Bank of America 2005 Annual Report Download - page 191
Download and view the complete annual report
Please find page 191 of the 2005 Bank of America annual report below. You can navigate through the pages in the report by either clicking on the pages listed below, or by using the keyword search tool below to find specific information within the annual report.-
 1
1 -
2
-
3
-
4
-
5
-
6
-
7
-
8
-
9
-
10
-
11
-
12
-
13
-
14
-
15
-
16
-
17
-
18
-
19
-
20
-
21
-
22
-
23
-
24
-
25
-
26
-
27
-
28
-
29
-
30
-
31
-
32
-
33
-
34
-
35
-
36
-
37
-
38
-
39
-
40
-
41
-
42
-
43
-
44
-
45
-
46
-
47
-
48
-
49
-
50
-
51
-
52
-
53
-
54
-
55
-
56
-
57
-
58
-
59
-
60
-
61
-
62
-
63
-
64
-
65
-
66
-
67
-
68
-
69
-
70
-
71
-
72
-
73
-
74
-
75
-
76
-
77
-
78
-
79
-
80
-
81
-
82
-
83
-
84
-
85
-
86
-
87
-
88
-
89
-
90
-
91
-
92
-
93
-
94
-
95
-
96
-
97
-
98
-
99
-
100
-
101
-
102
-
103
-
104
-
105
-
106
-
107
-
108
-
109
-
110
-
111
-
112
-
113
-
114
-
115
-
116
-
117
-
118
-
119
-
120
-
121
-
122
-
123
-
124
-
125
-
126
-
127
-
128
-
129
-
130
-
131
-
132
-
133
-
134
-
135
-
136
-
137
-
138
-
139
-
140
-
141
-
142
-
143
-
144
-
145
-
146
-
147
-
148
-
149
-
150
-
151
-
152
-
153
-
154
-
155
-
156
-
157
-
158
-
159
-
160
-
161
-
162
-
163
-
164
-
165
-
166
-
167
-
168
-
169
-
170
-
171
-
172
-
173
-
174
-
175
-
176
-
177
-
178
-
179
-
180
-
 181
181 -
 182
182 -
 183
183 -
 184
184 -
 185
185 -
 186
186 -
 187
187 -
 188
188 -
 189
189 -
 190
190 -
 191
191 -
 192
192 -
 193
193 -
 194
194 -
 195
195 -
 196
196 -
 197
197 -
 198
198 -
 199
199 -
 200
200 -
 201
201 -
202
-
203
-
204
-
205
-
206
-
207
-
208
-
209
-
210
-
211
-
212
-
213
 |
 |

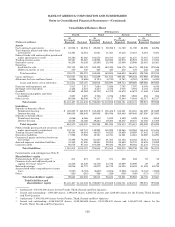
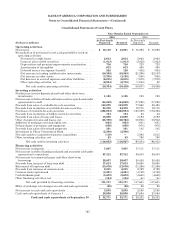
BANK OF AMERICA CORPORATION AND SUBSIDIARIES
Notes to Consolidated Financial Statements—(Continued)
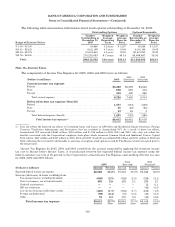
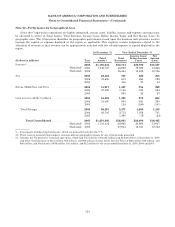
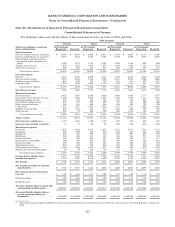
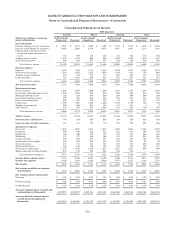
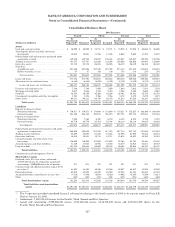
Note 23—Restatement of Quarterly Financial Statements (unaudited)
Consolidated Statement of Income
The following tables set forth the effects of the restatement for the quarters in 2005 and 2004.
2005 Quarters
Fourth Third Second First
(Dollars in millions, except per
share information) As Previously
Reported(1) Restated As Previously
Reported Restated As Previously
Reported Restated As Previously
Reported Restated
Interest income
Interest and fees on loans and leases . . . $ 9,559 $ 9,536 $ 8,956 $ 8,933 $ 8,312 $ 8,294 $ 8,107 $ 8,080
Interest and dividends on securities . . . . 2,819 2,815 2,797 2,793 2,799 2,796 2,534 2,533
Federal funds sold and securities
purchased under agreements to
resell ............................ 1,462 1,477 1,372 1,382 1,252 1,249 893 904
Trading account assets ............... 1,585 1,585 1,550 1,550 1,426 1,426 1,182 1,182
Otherinterestincome ................ 605 605 547 547 502 502 437 437
Totalinterestincome............. 16,030 16,018 15,222 15,205 14,291 14,267 13,153 13,136
Interest expense
Deposits ............................ 2,434 2,476 2,439 2,471 2,379 2,363 2,043 2,182
Short-term borrowings ............... 3,902 3,855 3,250 3,190 2,677 2,582 1,969 1,988
Trading account liabilities ............ 619 619 707 707 611 611 427 427
Long-term debt ...................... 1,215 1,209 1,053 1,102 974 1,074 841 1,033
Total interest expense ............ 8,170 8,159 7,449 7,470 6,641 6,630 5,280 5,630
Net interest income ................ 7,860 7,859 7,773 7,735 7,650 7,637 7,873 7,506
Noninterest income
Servicecharges ..................... 1,927 1,927 2,080 2,080 1,920 1,920 1,777 1,777
Investment and brokerage services . . . . 1,062 1,062 1,060 1,060 1,049 1,049 1,013 1,013
Mortgage banking income ............ 215 215 180 180 189 189 221 221
Investment banking income ........... 537 537 522 522 431 431 366 366
Equityinvestmentgains.............. 481 481 668 668 492 492 399 399
Cardincome ........................ 1,507 1,507 1,520 1,520 1,437 1,437 1,289 1,289
Trading account profits ............... 253 253 514 514 285 285 760 760
Otherincome ....................... 280 (31) 290 (128) 562 1,152 324 207
Total noninterest income ......... 6,262 5,951 6,834 6,416 6,365 6,955 6,149 6,032
Total revenue ..................... 14,122 13,810 14,607 14,151 14,015 14,592 14,022 13,538
Provision for credit losses ......... 1,400 1,400 1,159 1,159 875 875 580 580
Gains on sales of debt securities .... 71 71 29 29 325 325 659 659
Noninterest expense
Personnel .......................... 3,845 3,845 3,837 3,837 3,671 3,671 3,701 3,701
Occupancy .......................... 699 699 638 638 615 615 636 636
Equipment ......................... 305 305 300 300 297 297 297 297
Marketing .......................... 265 265 307 307 346 346 337 337
Professional fees .................... 283 283 254 254 216 216 177 177
Amortization of intangibles ........... 196 196 201 201 204 204 208 208
Dataprocessing ..................... 394 394 361 361 368 368 364 364
Telecommunications ................. 219 219 206 206 196 196 206 206
Other general operating .............. 1,055 1,055 1,061 1,061 985 985 1,019 1,019
Merger and restructuring charges . . . . . 59 59 120 120 121 121 112 112
Total noninterest expense ......... 7,320 7,320 7,285 7,285 7,019 7,019 7,057 7,057
Income before income taxes ........ 5,473 5,161 6,192 5,736 6,446 7,023 7,044 6,560
Income tax expense ................ 1,705 1,587 2,065 1,895 2,150 2,366 2,349 2,167
Net income ........................ $ 3,768 $ 3,574 $ 4,127 $ 3,841 $ 4,296 $ 4,657 $ 4,695 $ 4,393
Net income available to common
shareholders .................... $ 3,764 $ 3,570 $ 4,122 $ 3,836 $ 4,292 $ 4,653 $ 4,690 $ 4,388
Per common share information
Earnings ........................... $ 0.94 $ 0.89 $ 1.03 $ 0.96 $ 1.07 $ 1.16 $ 1.16 $ 1.09
Dilutedearnings .................... $ 0.93 $ 0.88 $ 1.02 $ 0.95 $ 1.06 $ 1.14 $ 1.14 $ 1.07
Dividends paid ...................... $ 0.50 $ 0.50 $ 0.50 $ 0.50 $ 0.45 $ 0.45 $ 0.45 $ 0.45
Average common shares issued and
outstanding (in thousands) ....... 3,996,024 3,996,024 4,000,573 4,000,573 4,005,356 4,005,356 4,032,550 4,032,550
Average diluted common shares
issued and outstanding (in
thousands) ...................... 4,053,859 4,053,859 4,054,659 4,054,659 4,065,355 4,065,355 4,099,062 4,099,062
(1) The Corporation provided unaudited financial information relating to the fourth quarter of 2005 in its current report on Form 8-K filed on January 23,
2006.
155