Bank of America 2005 Annual Report Download - page 62
Download and view the complete annual report
Please find page 62 of the 2005 Bank of America annual report below. You can navigate through the pages in the report by either clicking on the pages listed below, or by using the keyword search tool below to find specific information within the annual report.-
 1
1 -
2
-
3
-
4
-
5
-
6
-
7
-
8
-
9
-
10
-
11
-
12
-
13
-
14
-
15
-
16
-
17
-
18
-
19
-
20
-
21
-
22
-
23
-
24
-
25
-
26
-
27
-
28
-
29
-
30
-
31
-
32
-
33
-
34
-
35
-
36
-
37
-
38
-
39
-
40
-
41
-
42
-
43
-
44
-
45
-
46
-
47
-
48
-
49
-
50
-
51
-
 52
52 -
 53
53 -
 54
54 -
 55
55 -
 56
56 -
 57
57 -
 58
58 -
 59
59 -
 60
60 -
 61
61 -
 62
62 -
 63
63 -
 64
64 -
 65
65 -
 66
66 -
 67
67 -
 68
68 -
 69
69 -
 70
70 -
 71
71 -
 72
72 -
73
-
74
-
75
-
76
-
77
-
78
-
79
-
80
-
81
-
82
-
83
-
84
-
85
-
86
-
87
-
88
-
89
-
90
-
91
-
92
-
93
-
94
-
95
-
96
-
97
-
98
-
99
-
100
-
101
-
102
-
103
-
104
-
105
-
106
-
107
-
108
-
109
-
110
-
111
-
112
-
113
-
114
-
115
-
116
-
117
-
118
-
119
-
120
-
121
-
122
-
123
-
124
-
125
-
126
-
127
-
128
-
129
-
130
-
131
-
132
-
133
-
134
-
135
-
136
-
137
-
138
-
139
-
140
-
141
-
142
-
143
-
144
-
145
-
146
-
147
-
148
-
149
-
150
-
151
-
152
-
153
-
154
-
155
-
156
-
157
-
158
-
159
-
160
-
161
-
162
-
163
-
164
-
165
-
166
-
167
-
168
-
169
-
170
-
171
-
172
-
173
-
174
-
175
-
176
-
177
-
178
-
179
-
180
-
181
-
182
-
183
-
184
-
185
-
186
-
187
-
188
-
189
-
190
-
191
-
192
-
193
-
194
-
195
-
196
-
197
-
198
-
199
-
200
-
201
-
202
-
203
-
204
-
205
-
206
-
207
-
208
-
209
-
210
-
211
-
212
-
213
 |
 |

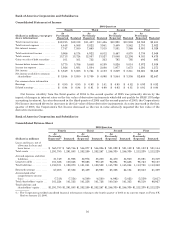
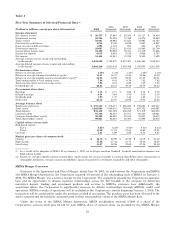
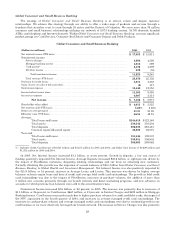
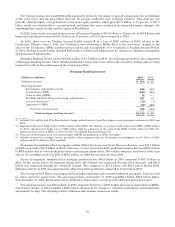
Core Net Interest Income—Managed Basis
In managing our business, we review core net interest income on a managed basis, which adjusts reported Net
Interest Income on a FTE basis for the impact of trading-related activities and revolving securitizations. As discussed in
the Global Capital Markets and Investment Banking business segment section beginning on page 35, we evaluate our
trading results and strategies based on total trading-related revenue, calculated by combining trading-related Net
Interest Income with Trading Account Profits. We also adjust for loans that we originated and sold into revolving credit
card, home equity line and commercial loan securitizations. Noninterest Income, rather than Net Interest Income and
Provision for Credit Losses, is recorded for assets that have been securitized as we are compensated for servicing the
securitized assets and record servicing income and gains or losses on securitizations, where appropriate. An analysis of
core net interest income—managed basis, core average earning assets—managed basis and core net interest yield on
earning assets—managed basis, which adjusts for the impact of these two non-core items from reported Net Interest
Income on a FTE basis, is shown below.
Table 4
Core Net Interest Income—Managed Basis
(Dollars in millions) 2005 2004
(Restated) 2003
(Restated)
Net interest income
As reported (FTE basis) ............................................................. $ 31,569 $ 28,677 $ 21,149
Impactoftrading-relatednetinterestincome .......................................... (1,444) (2,039) (2,235)
Core net interest income ...................................................... 30,125 26,638 18,914
Impact of revolving securitizations .................................................... 708 882 311
Core net interest income—managed basis ................................. $ 30,833 $ 27,520 $ 19,225
Average earning assets
Asreported ........................................................................ $1,111,994 $ 905,273 $ 649,598
Impact of trading-related earning assets ............................................... (299,374) (227,230) (172,428)
Core average earning assets .................................................. 812,620 678,043 477,170
Impact of revolving securitizations .................................................... 8,440 10,181 3,342
Core average earning assets—managed basis .............................. $ 821,060 $ 688,224 $ 480,512
Net interest yield contribution
As reported (FTE basis) ............................................................. 2.84% 3.17% 3.26%
Impact of trading-related activities ................................................... 0.87 0.76 0.70
Core net interest yield on earning assets ...................................... 3.71 3.93 3.96
Impact of revolving securitizations .................................................... 0.04 0.06 0.03
Core net interest yield on earning assets—managed basis .................. 3.75% 3.99% 3.99%
Core net interest income on a managed basis increased $3.3 billion for 2005. This increase was driven by the impact
of the FleetBoston Merger, organic growth in consumer (primarily credit card and home equity) and commercial loans,
higher domestic deposit levels and a larger ALM portfolio (primarily securities). Partially offsetting these increases was
the adverse impact of spread compression due to the flattening of the yield curve.
Core average earning assets on a managed basis increased $132.8 billion primarily due to higher ALM levels
(primarily securities) and higher levels of consumer loans (primarily home equity and credit card). The increases in these
assets were due to organic growth as well as the impact of the FleetBoston Merger.
The core net interest yield on a managed basis decreased 24 bps as a result of the impact of spread compression due
to flattening of the yield curve and a larger ALM portfolio partially offset by higher levels of core deposits and consumer
loans.
Business Segment Operations
Segment Description
The Corporation reports the results of its operations through four business segments: Global Consumer and Small
Business Banking,Global Business and Financial Services,Global Capital Markets and Investment Banking, and Global
Wealth and Investment Management. During the third quarter of 2005, our operations in Mexico were realigned and are
now included in the results of Global Business and Financial Services, rather than Global Capital Markets and
Investment Banking. Also during the third quarter of 2005, we announced the future combination of Global Business and
Financial Services and Global Capital Markets and Investment Banking that was effective on January 1, 2006. This new
26