Bank of America 2005 Annual Report Download - page 176
Download and view the complete annual report
Please find page 176 of the 2005 Bank of America annual report below. You can navigate through the pages in the report by either clicking on the pages listed below, or by using the keyword search tool below to find specific information within the annual report.-
 1
1 -
2
-
3
-
4
-
5
-
6
-
7
-
8
-
9
-
10
-
11
-
12
-
13
-
14
-
15
-
16
-
17
-
18
-
19
-
20
-
21
-
22
-
23
-
24
-
25
-
26
-
27
-
28
-
29
-
30
-
31
-
32
-
33
-
34
-
35
-
36
-
37
-
38
-
39
-
40
-
41
-
42
-
43
-
44
-
45
-
46
-
47
-
48
-
49
-
50
-
51
-
52
-
53
-
54
-
55
-
56
-
57
-
58
-
59
-
60
-
61
-
62
-
63
-
64
-
65
-
66
-
67
-
68
-
69
-
70
-
71
-
72
-
73
-
74
-
75
-
76
-
77
-
78
-
79
-
80
-
81
-
82
-
83
-
84
-
85
-
86
-
87
-
88
-
89
-
90
-
91
-
92
-
93
-
94
-
95
-
96
-
97
-
98
-
99
-
100
-
101
-
102
-
103
-
104
-
105
-
106
-
107
-
108
-
109
-
110
-
111
-
112
-
113
-
114
-
115
-
116
-
117
-
118
-
119
-
120
-
121
-
122
-
123
-
124
-
125
-
126
-
127
-
128
-
129
-
130
-
131
-
132
-
133
-
134
-
135
-
136
-
137
-
138
-
139
-
140
-
141
-
142
-
143
-
144
-
145
-
146
-
147
-
148
-
149
-
150
-
151
-
152
-
153
-
154
-
155
-
156
-
157
-
158
-
159
-
160
-
161
-
162
-
163
-
164
-
165
-
 166
166 -
 167
167 -
 168
168 -
 169
169 -
 170
170 -
 171
171 -
 172
172 -
 173
173 -
 174
174 -
 175
175 -
 176
176 -
 177
177 -
 178
178 -
 179
179 -
 180
180 -
 181
181 -
 182
182 -
 183
183 -
 184
184 -
 185
185 -
 186
186 -
187
-
188
-
189
-
190
-
191
-
192
-
193
-
194
-
195
-
196
-
197
-
198
-
199
-
200
-
201
-
202
-
203
-
204
-
205
-
206
-
207
-
208
-
209
-
210
-
211
-
212
-
213
 |
 |

BANK OF AMERICA CORPORATION AND SUBSIDIARIES
Notes to Consolidated Financial Statements—(Continued)
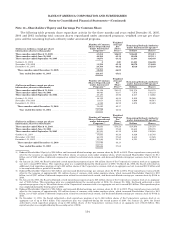
The following table summarizes the changes in the fair value of plan assets, changes in the projected benefit
obligation (PBO), the funded status of both the accumulated benefit obligation (ABO) and the PBO, and the weighted
average assumptions used to determine benefit obligations for the pension plans and postretirement plans at
December 31, 2005 and 2004. Prepaid and accrued benefit costs are reflected in Other Assets, and Accrued Expenses and
Other Liabilities on the Consolidated Balance Sheet. The discount rate assumption is based on a cash flow matching
technique and this assumption is subject to change each year. This technique utilizes a yield curve based upon Moody’s
Aa corporate bonds with cash flows that match estimated benefit payments to produce the discount rate assumption. For
the Pension Plan and the FleetBoston Pension Plan (the Qualified Pension Plans), as well as the Postretirement Health
and Life Plans, the discount rate at December 31, 2005, was 5.50 percent. For both the Qualified Pension Plans and the
Postretirement Health and Life Plans, the expected long-term return on plan assets will be 8.00 percent for 2006. The
expected return on plan assets is determined using the calculated market-related value for the Qualified Pension Plans
and the fair value for the Postretirement Health and Life Plans. The asset valuation method for the Qualified Pension
Plans recognizes 60 percent of the market gains or losses in the first year, with the remaining 40 percent spread equally
over the next four years.
Qualified Pension
Plans(1)
Nonqualified
Pension Plans(1)
Postretirement
Health and Life Plans(1)
(Dollars in millions) 2005 2004 2005 2004 2005 2004
Change in fair value of plan assets
(Primarily listed stocks, fixed income and real
estate)
Fair value, January 1 ............................... $12,153 $ 8,975 $1$— $ 166 $ 156
FleetBoston balance, April 1, 2004 ...................... —2,277 —1—45
Actual return on plan assets ........................... 803 1,447 ——11 25
Company contributions(2) .............................. 1,000 200 118 63 27 40
Plan participant contributions ......................... ————98 82
Benefits paid ........................................ (859) (746) (118) (63) (176) (182)
Fair value, December 31 ........................ $13,097 $12,153 $1$1 $ 126 $ 166
Change in projected benefit obligation
Projected benefit obligation, January 1 ............. $11,461 $ 8,428 $ 1,094 $ 712 $ 1,352 $ 1,127
FleetBoston balance, April 1, 2004 ...................... —2,045 —377 —196
Servicecost.......................................... 261 257 11 27 11 9
Interestcost ......................................... 643 623 61 62 78 76
Plan participant contributions ......................... ————98 82
Plan amendments .................................... (77) 19 (1) (74) —(12)
Actuarialloss ........................................ 261 835 61 53 57 56
Benefits paid ........................................ (859) (746) (118) (63) (176) (182)
Projected benefit obligation, December 31 ....... $11,690 $11,461 $ 1,108 $ 1,094 $ 1,420 $ 1,352
Funded status, December 31
Accumulated benefit obligation (ABO) .................. $11,383 $11,025 $ 1,085 $ 1,080 n/a n/a
Overfunded (unfunded) status of ABO .................. 1,714 1,128 (1,084) (1,079) n/a n/a
Provisionforfuturesalaries ........................... 307 436 23 14 n/a n/a
Projected benefit obligation (PBO) ...................... 11,690 11,461 1,108 1,094 1,420 $ 1,352
Overfunded (unfunded) status of PBO ................... $ 1,407 $ 692 $(1,107) $(1,093) $(1,294) $(1,186)
Unrecognized net actuarial loss ........................ 2,621 2,364 262 234 92 112
Unrecognized transition obligation ..................... ————221 252
Unrecognized prior service cost ........................ 209 328 (52) (59) ——
Prepaid (accrued) benefit cost .................. $ 4,237 $ 3,384 $ (897) $ (918) $ (981) $ (822)
Weighted average assumptions, December 31
Discount rate(3) ...................................... 5.50% 5.75% 5.50% 5.75% 5.50% 5.75%
Expected return on plan assets ......................... 8.50 8.50 n/a n/a 8.50 8.50
Rate of compensation increase ......................... 4.00 4.00 4.00 4.00 n/a n/a
(1) The measurement date for the Qualified Pension Plans, Nonqualified Pension Plans, and Postretirement Health and Life Plans was
December 31 of each year reported.
(2) The Corporation’s best estimate of its contributions to be made to the Qualified Pension Plans, Nonqualified Pension Plans, and
Postretirement Health and Life Plans in 2006 is $0 million, $97 million and $37 million.
(3) In connection with the FleetBoston Merger, the plans of former FleetBoston were remeasured on April 1, 2004, using a discount
rate of 6.00 percent.
n/a = not applicable
140