Bank of America 2005 Annual Report Download - page 79
Download and view the complete annual report
Please find page 79 of the 2005 Bank of America annual report below. You can navigate through the pages in the report by either clicking on the pages listed below, or by using the keyword search tool below to find specific information within the annual report.-
 1
1 -
2
-
3
-
4
-
5
-
6
-
7
-
8
-
9
-
10
-
11
-
12
-
13
-
14
-
15
-
16
-
17
-
18
-
19
-
20
-
21
-
22
-
23
-
24
-
25
-
26
-
27
-
28
-
29
-
30
-
31
-
32
-
33
-
34
-
35
-
36
-
37
-
38
-
39
-
40
-
41
-
42
-
43
-
44
-
45
-
46
-
47
-
48
-
49
-
50
-
51
-
52
-
53
-
54
-
55
-
56
-
57
-
58
-
59
-
60
-
61
-
62
-
63
-
64
-
65
-
66
-
67
-
68
-
 69
69 -
 70
70 -
 71
71 -
 72
72 -
 73
73 -
 74
74 -
 75
75 -
 76
76 -
 77
77 -
 78
78 -
 79
79 -
 80
80 -
 81
81 -
 82
82 -
 83
83 -
 84
84 -
 85
85 -
 86
86 -
 87
87 -
 88
88 -
 89
89 -
90
-
91
-
92
-
93
-
94
-
95
-
96
-
97
-
98
-
99
-
100
-
101
-
102
-
103
-
104
-
105
-
106
-
107
-
108
-
109
-
110
-
111
-
112
-
113
-
114
-
115
-
116
-
117
-
118
-
119
-
120
-
121
-
122
-
123
-
124
-
125
-
126
-
127
-
128
-
129
-
130
-
131
-
132
-
133
-
134
-
135
-
136
-
137
-
138
-
139
-
140
-
141
-
142
-
143
-
144
-
145
-
146
-
147
-
148
-
149
-
150
-
151
-
152
-
153
-
154
-
155
-
156
-
157
-
158
-
159
-
160
-
161
-
162
-
163
-
164
-
165
-
166
-
167
-
168
-
169
-
170
-
171
-
172
-
173
-
174
-
175
-
176
-
177
-
178
-
179
-
180
-
181
-
182
-
183
-
184
-
185
-
186
-
187
-
188
-
189
-
190
-
191
-
192
-
193
-
194
-
195
-
196
-
197
-
198
-
199
-
200
-
201
-
202
-
203
-
204
-
205
-
206
-
207
-
208
-
209
-
210
-
211
-
212
-
213
 |
 |
majority of the expected losses or expected residual returns of the entity, or both. We have determined that we are not
the primary beneficiary of the commercial paper conduits described above and, therefore, have not included the assets
and liabilities or results of operations of these conduits in the Consolidated Financial Statements of the Corporation.
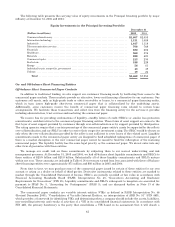
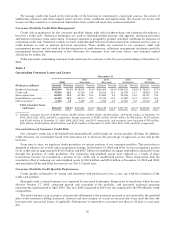
On-balance Sheet Commercial Paper Conduits
In addition to the off-balance sheet financing entities previously described, we also utilize commercial paper
conduits that have been consolidated based on our determination that we are the primary beneficiary of the entities in
accordance with FIN 46R. At December 31, 2005 and 2004, the consolidated assets and liabilities of these conduits were
reflected in AFS Securities, Other Assets, and Commercial Paper and Other Short-term Borrowings in Global Capital
Markets and Investment Banking. At December 31, 2005 and 2004, we held $6.6 billion and $7.7 billion of assets of these
entities while our maximum loss exposure associated with these entities, including unfunded lending commitments, was
approximately $8.0 billion and $9.4 billion. We manage our credit risk on the on-balance sheet commitments by
subjecting them to the same processes as the off-balance sheet commitments.
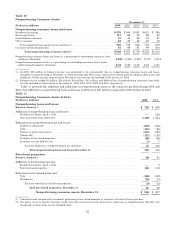
Qualified Special Purpose Entities
In addition, to control our capital position, diversify funding sources and provide customers with commercial paper
investments, we will, from time to time, sell assets to off-balance sheet commercial paper entities. The commercial paper
entities are Qualified Special Purpose Entities (QSPEs) that have been isolated beyond our reach or that of our creditors,
even in the event of bankruptcy or other receivership. The accounting for these entities is governed by SFAS 140,
“Accounting for Transfers and Servicing of Financial Assets and Extinguishments of Liabilities—a replacement of FASB
Statement No. 125,” (SFAS 140) which provides that QSPEs are not included in the consolidated financial statements of
the seller. Assets sold to the entities consist of high-grade corporate or municipal bonds, collateralized debt obligations
and asset-backed securities. These entities issue collateralized commercial paper or notes with similar repricing
characteristics to third party market participants and passive derivative instruments to us. Assets sold to the entities
typically have an investment rating ranging from Aaa/AAA to Aa/AA. We may provide liquidity, SBLCs or similar loss
protection commitments to the entity, or we may enter into derivatives with the entity in which we assume certain risks.
The liquidity facility and derivatives have the same legal standing with the commercial paper.
The derivatives provide interest rate, currency and a pre-specified amount of credit protection to the entity in
exchange for the commercial paper rate. These derivatives are provided for in the legal documents and help to alleviate
any cash flow mismatches. In some cases, if an asset’s rating declines below a certain investment quality as evidenced by
its investment rating or defaults, we are no longer exposed to the risk of loss. At that time, the commercial paper holders
assume the risk of loss. In other cases, we agree to assume all of the credit exposure related to the referenced asset.
Legal documents for each entity specify asset quality levels that require the entity to automatically dispose of the asset
once the asset falls below the specified quality rating. At the time the asset is disposed, we are required to reimburse the
entity for any credit-related losses depending on the pre-specified level of protection provided.
We manage any credit or market risk on commitments or derivatives through normal underwriting and risk
management processes. At December 31, 2005 and 2004, we had off-balance sheet liquidity commitments, SBLCs and
other financial guarantees to these entities of $7.1 billion and $7.4 billion. Substantially all of these commitments
mature within one year and are included in Table 6. Derivative activity related to these entities is included in Note 5 of
the Consolidated Financial Statements. Net revenues earned from fees associated with these entities were $86 million
and $61 million in 2005 and 2004.
We generally do not purchase any of the commercial paper issued by these types of financing entities other than
during the underwriting process when we act as issuing agent nor do we purchase any of the commercial paper for our
own account. Derivative instruments related to these entities are marked to market through the Consolidated Statement
of Income. SBLCs are initially recorded at fair value in accordance with FIN 45. Liquidity commitments and SBLCs
subsequent to inception are accounted for pursuant to SFAS 5 and are discussed further in Note 13 of the Consolidated
Financial Statements.
Credit and Liquidity Risks
Because we provide liquidity and credit support to the commercial paper conduits and QSPEs described above, our
credit ratings and changes thereto will affect the borrowing cost and liquidity of these entities. In addition, significant
changes in counterparty asset valuation and credit standing may also affect the liquidity of the commercial paper
issuance. Disruption in the commercial paper markets may result in our having to fund under these commitments and
SBLCs discussed above. We seek to manage these risks, along with all other credit and liquidity risks, within our
policies and practices. See Notes 1 and 9 of the Consolidated Financial Statements for additional discussion of
off-balance sheet financing entities.
43