Bank of America 2005 Annual Report Download - page 68
Download and view the complete annual report
Please find page 68 of the 2005 Bank of America annual report below. You can navigate through the pages in the report by either clicking on the pages listed below, or by using the keyword search tool below to find specific information within the annual report.-
 1
1 -
2
-
3
-
4
-
5
-
6
-
7
-
8
-
9
-
10
-
11
-
12
-
13
-
14
-
15
-
16
-
17
-
18
-
19
-
20
-
21
-
22
-
23
-
24
-
25
-
26
-
27
-
28
-
29
-
30
-
31
-
32
-
33
-
34
-
35
-
36
-
37
-
38
-
39
-
40
-
41
-
42
-
43
-
44
-
45
-
46
-
47
-
48
-
49
-
50
-
51
-
52
-
53
-
54
-
55
-
56
-
57
-
 58
58 -
 59
59 -
 60
60 -
 61
61 -
 62
62 -
 63
63 -
 64
64 -
 65
65 -
 66
66 -
 67
67 -
 68
68 -
 69
69 -
 70
70 -
 71
71 -
 72
72 -
 73
73 -
 74
74 -
 75
75 -
 76
76 -
 77
77 -
 78
78 -
79
-
80
-
81
-
82
-
83
-
84
-
85
-
86
-
87
-
88
-
89
-
90
-
91
-
92
-
93
-
94
-
95
-
96
-
97
-
98
-
99
-
100
-
101
-
102
-
103
-
104
-
105
-
106
-
107
-
108
-
109
-
110
-
111
-
112
-
113
-
114
-
115
-
116
-
117
-
118
-
119
-
120
-
121
-
122
-
123
-
124
-
125
-
126
-
127
-
128
-
129
-
130
-
131
-
132
-
133
-
134
-
135
-
136
-
137
-
138
-
139
-
140
-
141
-
142
-
143
-
144
-
145
-
146
-
147
-
148
-
149
-
150
-
151
-
152
-
153
-
154
-
155
-
156
-
157
-
158
-
159
-
160
-
161
-
162
-
163
-
164
-
165
-
166
-
167
-
168
-
169
-
170
-
171
-
172
-
173
-
174
-
175
-
176
-
177
-
178
-
179
-
180
-
181
-
182
-
183
-
184
-
185
-
186
-
187
-
188
-
189
-
190
-
191
-
192
-
193
-
194
-
195
-
196
-
197
-
198
-
199
-
200
-
201
-
202
-
203
-
204
-
205
-
206
-
207
-
208
-
209
-
210
-
211
-
212
-
213
 |
 |

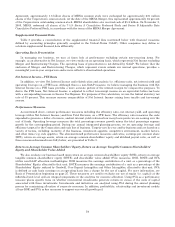
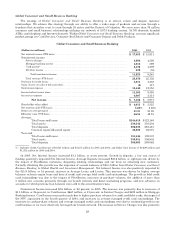
Net Interest Income decreased $102 million primarily driven by the impact of spread compression due to flattening
of the yield curve and the $2.3 billion decrease in average residential first mortgage balances. This decrease was
partially offset by higher average balances in the home equity portfolio, which grew $11.2 billion, or 31 percent, to $47.7
billion which was attributable to account growth and larger line sizes resulting from enhanced product offerings, the
expanding home equity market and the impact of FleetBoston.
In 2005, home equity average balances across all business lines grew $18.8 billion, or 42 percent, to $63.9 billion and
home equity production improved $15.3 billion, or 27 percent, to $72.0 billion compared to 2004.
In 2005, there were no Trading Account Profits compared to a loss of $349 million in 2004, related to the
Certificates. Effective June 1, 2004, the Certificates were converted to MSRs. Prior to the conversion, changes in the
value of the Certificates, MSRs and derivatives used for risk management were recognized as Trading Account Profits.
In 2004, Trading Account Profits included $342 million of downward adjustments for changes to valuation assumptions
and prepayment adjustments.
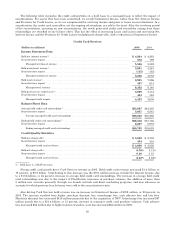
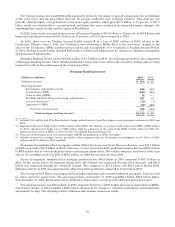
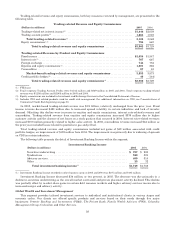
Mortgage Banking Income increased $423 million to $1.0 billion in 2005. The following summarizes the components
of Mortgage Banking Income which include production income from loans sold in the secondary market and servicing
income that reflects the performance of the servicing portfolio.
Mortgage Banking Income
(Dollars in millions) 2005 2004
Production income(1) ........................................................................... $ 674 $ 765
Servicing income:
Servicing fees and ancillary income .......................................................... 848 615
AmortizationofMSRs ...................................................................... (613) (345)
GainsonsalesofMSRs..................................................................... 14 —
Net MSR and SFAS 133 derivative hedge adjustments(2) ........................................ 167 18
Losses on derivatives(3) ..................................................................... (15) (1)
ImpairmentofMSRs ....................................................................... (63) (463)
Total net servicing income .............................................................. 338 (176)
Total mortgage banking income(4) ................................................ $1,012 $ 589
(1) Includes $(14) million and $2 million related to hedge ineffectiveness of cash flow hedges on our mortgage warehouse for 2005 and
2004.
(2) Represents derivative hedge losses of $124 million under SFAS 133, offset by an increase in the value of the MSRs of $291 million
for 2005, and derivative hedge gains of $228 million offset by a decrease in the value of the MSRs of $210 million for 2004. For
additional information on MSRs, see Note 9 of the Consolidated Financial Statements.
(3) Net losses on derivatives used as economic hedges of MSRs not designated as SFAS 133 hedges.
(4) Includes revenue for mortgage services provided to other segments that are eliminated in consolidation (in All Other) of $207
million and $175 million for 2005 and 2004.
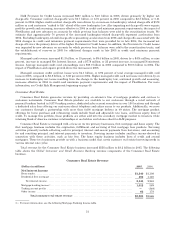
Production for residential first mortgages, within Global Consumer and Small Business Banking, was $74.7 billion
in 2005 compared to $80.2 billion in 2004, a decrease of seven percent. In 2005, production income decreased $91 million
to $674 million due to lower production volume and margin compression. The volume reduction resulted in lower loan
sales to the secondary market in 2005 of $65.1 billion, an eight percent decrease from 2004.
Across all segments, residential first mortgage production was $86.8 billion in 2005 compared to $87.5 billion in
2004. Of the volume across all segments during 2005, $60.3 billion was originated through retail channels, and $26.5
billion was originated through the wholesale channel. This compares to $57.6 billion and $30.0 billion during 2004.
Refinance activity in 2005 was approximately 49 percent of the production compared to 57 percent in 2004.
The Consumer Real Estate servicing portfolio includes originated and retained residential mortgages, loans serviced
for others and home equity loans. The servicing portfolio at December 31, 2005 was $368.4 billion, $35.9 billion higher
than December 31, 2004, driven primarily by production, home equity account growth and lower prepayment rates.
Net servicing income rose $514 million in 2005, primarily driven by a $400 million decrease in impairment of MSRs.
Impairment charges in 2004 included a $261 million adjustment for changes in valuation assumptions and prepayment
adjustments to align with changing market conditions and customer behavioral trends.
32