Bank of America 2005 Annual Report Download - page 92
Download and view the complete annual report
Please find page 92 of the 2005 Bank of America annual report below. You can navigate through the pages in the report by either clicking on the pages listed below, or by using the keyword search tool below to find specific information within the annual report.-
 1
1 -
2
-
3
-
4
-
5
-
6
-
7
-
8
-
9
-
10
-
11
-
12
-
13
-
14
-
15
-
16
-
17
-
18
-
19
-
20
-
21
-
22
-
23
-
24
-
25
-
26
-
27
-
28
-
29
-
30
-
31
-
32
-
33
-
34
-
35
-
36
-
37
-
38
-
39
-
40
-
41
-
42
-
43
-
44
-
45
-
46
-
47
-
48
-
49
-
50
-
51
-
52
-
53
-
54
-
55
-
56
-
57
-
58
-
59
-
60
-
61
-
62
-
63
-
64
-
65
-
66
-
67
-
68
-
69
-
70
-
71
-
72
-
73
-
74
-
75
-
76
-
77
-
78
-
79
-
80
-
81
-
 82
82 -
 83
83 -
 84
84 -
 85
85 -
 86
86 -
 87
87 -
 88
88 -
 89
89 -
 90
90 -
 91
91 -
 92
92 -
 93
93 -
 94
94 -
 95
95 -
 96
96 -
 97
97 -
 98
98 -
 99
99 -
 100
100 -
 101
101 -
 102
102 -
103
-
104
-
105
-
106
-
107
-
108
-
109
-
110
-
111
-
112
-
113
-
114
-
115
-
116
-
117
-
118
-
119
-
120
-
121
-
122
-
123
-
124
-
125
-
126
-
127
-
128
-
129
-
130
-
131
-
132
-
133
-
134
-
135
-
136
-
137
-
138
-
139
-
140
-
141
-
142
-
143
-
144
-
145
-
146
-
147
-
148
-
149
-
150
-
151
-
152
-
153
-
154
-
155
-
156
-
157
-
158
-
159
-
160
-
161
-
162
-
163
-
164
-
165
-
166
-
167
-
168
-
169
-
170
-
171
-
172
-
173
-
174
-
175
-
176
-
177
-
178
-
179
-
180
-
181
-
182
-
183
-
184
-
185
-
186
-
187
-
188
-
189
-
190
-
191
-
192
-
193
-
194
-
195
-
196
-
197
-
198
-
199
-
200
-
201
-
202
-
203
-
204
-
205
-
206
-
207
-
208
-
209
-
210
-
211
-
212
-
213
 |
 |

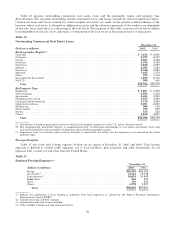
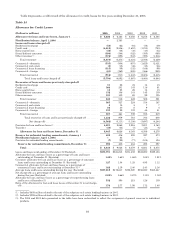
Table 16 presents outstanding commercial real estate loans and the geographic region and property type
diversification. The amounts outstanding exclude commercial loans and leases secured by owner-occupied real estate.
Commercial loans and leases secured by owner-occupied real estate are made on the general creditworthiness of the
borrower where real estate is obtained as additional security and the ultimate repayment of the credit is not dependent
on the sale, lease and rental, or refinancing of the real estate. For purposes of this table, commercial real estate reflects
loans dependent on the sale, lease and rental, or refinancing of the real estate as the primary source of repayment.
Table 16
Outstanding Commercial Real Estate Loans
December 31
(Dollars in millions) 2005 2004
By Geographic Region(1)
California .......................................................................................... $ 7,615 $ 6,293
Northeast .......................................................................................... 6,337 6,700
Florida............................................................................................. 4,507 3,562
Southeast .......................................................................................... 4,370 3,448
Southwest .......................................................................................... 3,658 3,265
Midwest............................................................................................ 2,595 1,860
Northwest .......................................................................................... 2,048 2,038
Midsouth ........................................................................................... 1,485 1,379
Other .............................................................................................. 873 1,184
Geographically diversified(2) .......................................................................... 1,693 2,150
Non-U.S. ........................................................................................... 585 440
Total .......................................................................................... $35,766 $32,319
By Property Type
Residential ......................................................................................... $ 7,601 $ 5,992
Office buildings ..................................................................................... 4,984 5,434
Apartments......................................................................................... 4,461 4,940
Shopping centers/retail ............................................................................... 4,165 4,490
Land and land development .......................................................................... 3,715 2,388
Industrial/warehouse ................................................................................ 3,031 2,263
Multiple use ........................................................................................ 996 744
Hotels/motels ....................................................................................... 790 909
Resorts ............................................................................................ 183 252
Other(3) ............................................................................................ 5,840 4,907
Total .......................................................................................... $35,766 $32,319
(1) Distribution is based on geographic location of collateral. Geographic regions are in the U.S. unless otherwise noted.
(2) The geographically diversified category is comprised primarily of unsecured outstandings to real estate investment trusts and
national homebuilders whose portfolios of properties span multiple geographic regions.
(3) Represents loans to borrowers whose primary business is commercial real estate, but the exposure is not secured by the listed
property types.
Foreign Portfolio
Table 17 sets forth total foreign exposure broken out by region at December 31, 2005 and 2004. Total foreign
exposure is defined to include credit exposure, net of local liabilities, plus securities and other investments for all
exposure with a country of risk other than the United States.
Table 17
Regional Foreign Exposure(1)
December 31
(Dollars in millions) 2005 2004
Europe.......................................................................... $61,953 $62,428
Asia Pacific(2) .................................................................... 14,113 10,736
Latin America(3) .................................................................. 10,651 10,948
MiddleEast ..................................................................... 616 527
Africa ........................................................................... 110 238
Other(4) ......................................................................... 4,778 5,327
Total ....................................................................... $92,221 $90,204
(1) Reflects the subtraction of local funding or liabilities from local exposures as allowed by the Federal Financial Institutions
Examination Council (FFIEC).
(2) Includes Australia and New Zealand.
(3) Includes Bermuda and Cayman Islands.
(4) Other includes Canada and supranational entities.
56