Bank of America 2005 Annual Report Download - page 95
Download and view the complete annual report
Please find page 95 of the 2005 Bank of America annual report below. You can navigate through the pages in the report by either clicking on the pages listed below, or by using the keyword search tool below to find specific information within the annual report.-
 1
1 -
2
-
3
-
4
-
5
-
6
-
7
-
8
-
9
-
10
-
11
-
12
-
13
-
14
-
15
-
16
-
17
-
18
-
19
-
20
-
21
-
22
-
23
-
24
-
25
-
26
-
27
-
28
-
29
-
30
-
31
-
32
-
33
-
34
-
35
-
36
-
37
-
38
-
39
-
40
-
41
-
42
-
43
-
44
-
45
-
46
-
47
-
48
-
49
-
50
-
51
-
52
-
53
-
54
-
55
-
56
-
57
-
58
-
59
-
60
-
61
-
62
-
63
-
64
-
65
-
66
-
67
-
68
-
69
-
70
-
71
-
72
-
73
-
74
-
75
-
76
-
77
-
78
-
79
-
80
-
81
-
82
-
83
-
84
-
 85
85 -
 86
86 -
 87
87 -
 88
88 -
 89
89 -
 90
90 -
 91
91 -
 92
92 -
 93
93 -
 94
94 -
 95
95 -
 96
96 -
 97
97 -
 98
98 -
 99
99 -
 100
100 -
 101
101 -
 102
102 -
 103
103 -
 104
104 -
 105
105 -
106
-
107
-
108
-
109
-
110
-
111
-
112
-
113
-
114
-
115
-
116
-
117
-
118
-
119
-
120
-
121
-
122
-
123
-
124
-
125
-
126
-
127
-
128
-
129
-
130
-
131
-
132
-
133
-
134
-
135
-
136
-
137
-
138
-
139
-
140
-
141
-
142
-
143
-
144
-
145
-
146
-
147
-
148
-
149
-
150
-
151
-
152
-
153
-
154
-
155
-
156
-
157
-
158
-
159
-
160
-
161
-
162
-
163
-
164
-
165
-
166
-
167
-
168
-
169
-
170
-
171
-
172
-
173
-
174
-
175
-
176
-
177
-
178
-
179
-
180
-
181
-
182
-
183
-
184
-
185
-
186
-
187
-
188
-
189
-
190
-
191
-
192
-
193
-
194
-
195
-
196
-
197
-
198
-
199
-
200
-
201
-
202
-
203
-
204
-
205
-
206
-
207
-
208
-
209
-
210
-
211
-
212
-
213
 |
 |

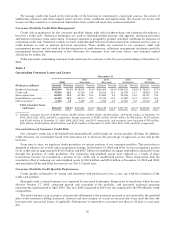
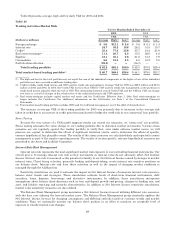
Commercial Portfolio Credit Quality Performance
Overall commercial credit quality continued to improve in 2005; however, the rate of improvement slowed in the
second half of the year.
Table 20 presents commercial net charge-offs and net charge-off ratios for 2005 and 2004.
Table 20
Commercial Net Charge-offs and Net Charge-off Ratios(1)
2005 2004
(Dollars in millions) Amount Percent Amount Percent
Commercial—domestic ......................................... $170 0.13% $177 0.15%
Commercial real estate ......................................... —— (3) (0.01)
Commercial lease financing ..................................... 231 1.13 90.05
Commercial—foreign ........................................... (72) (0.39) 173 1.05
Total commercial ........................................ $329 0.16% $356 0.20%
(1) Percentage amounts are calculated as net charge-offs divided by average outstanding loans and leases during the year for each loan
category.
Commercial net charge-offs were $329 million for 2005 compared to $356 million for 2004. Commercial lease
financing net charge-offs increased $222 million in 2005 compared to 2004 primarily due to the domestic airline
industry. Commercial—foreign net recoveries were $72 million in 2005 compared to net charge-offs of $173 million in
2004. Recoveries were centered in Bermuda, Latin America, India and the United Kingdom. Commercial—foreign net
charge-offs of $173 million in 2004 were primarily related to one borrower in the food products industry.
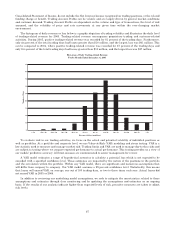
As presented in Table 21, commercial criticized credit exposure decreased $2.7 billion, or 27 percent, to $7.5 billion
at December 31, 2005. The net decrease was driven by $9.9 billion of paydowns, payoffs, credit quality improvements,
charge-offs principally related to the domestic airline industry, and loan sales. Reductions were distributed across many
industries of which the largest were airlines, utilities and media. These decreases were partially offset by $7.2 billion of
newly criticized exposure. Global Business and Financial Services accounted for 54 percent, or $1.5 billion, of the
decrease in commercial criticized exposure centered in Commercial Aviation,Latin America and Middle Market
Banking, which comprised 20 percent, 15 percent and 9 percent of the total decrease. Global Capital Markets and
Investment Banking accounted for 33 percent, or $896 million, of the decrease in criticized exposure.
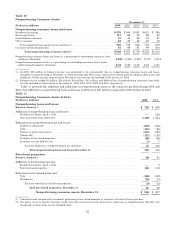
Table 21
Commercial Criticized Exposure(1)
December 31
2005 2004
(Dollars in millions) Amount Percent(2) Amount Percent(2)
Commercial—domestic ..................................... $5,259 2.62% $ 6,340 3.38%
Commercial real estate ..................................... 723 1.63 1,028 2.54
Commercial lease financing ................................. 611 2.95 1,347 6.38
Commercial—foreign ...................................... 934 1.73 1,534 3.12
Total commercial criticized exposure ................. $7,527 2.35% $10,249 3.44%
(1) Criticized exposure corresponds to the Special Mention, Substandard and Doubtful asset categories defined by regulatory
authorities. Exposure amounts include loans and leases, SBLCs and financial guarantees, derivative assets, assets held-for-sale
and commercial letters of credit.
(2) Commercial criticized exposure is taken as a percentage of total commercial utilized exposure.
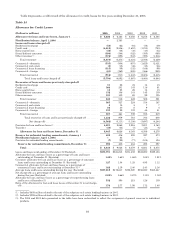
We routinely review the loan and lease portfolio to determine if any credit exposure should be placed on
nonperforming status. An asset is placed on nonperforming status when it is determined that full collection of principal
and/or interest in accordance with its contractual terms is not probable. As presented in Table 22, nonperforming
commercial assets decreased $891 million to $757 million at December 31, 2005 due primarily to the $749 million
decrease in nonperforming commercial loans and leases.
The decrease in total nonperforming commercial loans and leases primarily resulted from paydowns and payoffs of
$686 million, gross charge-offs of $669 million, returns to performing status of $152 million and loan sales of $108
million. These decreases were partially offset by new nonaccrual loans of $929 million.
59