Bank of America 2005 Annual Report Download - page 97
Download and view the complete annual report
Please find page 97 of the 2005 Bank of America annual report below. You can navigate through the pages in the report by either clicking on the pages listed below, or by using the keyword search tool below to find specific information within the annual report.-
 1
1 -
2
-
3
-
4
-
5
-
6
-
7
-
8
-
9
-
10
-
11
-
12
-
13
-
14
-
15
-
16
-
17
-
18
-
19
-
20
-
21
-
22
-
23
-
24
-
25
-
26
-
27
-
28
-
29
-
30
-
31
-
32
-
33
-
34
-
35
-
36
-
37
-
38
-
39
-
40
-
41
-
42
-
43
-
44
-
45
-
46
-
47
-
48
-
49
-
50
-
51
-
52
-
53
-
54
-
55
-
56
-
57
-
58
-
59
-
60
-
61
-
62
-
63
-
64
-
65
-
66
-
67
-
68
-
69
-
70
-
71
-
72
-
73
-
74
-
75
-
76
-
77
-
78
-
79
-
80
-
81
-
82
-
83
-
84
-
85
-
86
-
 87
87 -
 88
88 -
 89
89 -
 90
90 -
 91
91 -
 92
92 -
 93
93 -
 94
94 -
 95
95 -
 96
96 -
 97
97 -
 98
98 -
 99
99 -
 100
100 -
 101
101 -
 102
102 -
 103
103 -
 104
104 -
 105
105 -
 106
106 -
 107
107 -
108
-
109
-
110
-
111
-
112
-
113
-
114
-
115
-
116
-
117
-
118
-
119
-
120
-
121
-
122
-
123
-
124
-
125
-
126
-
127
-
128
-
129
-
130
-
131
-
132
-
133
-
134
-
135
-
136
-
137
-
138
-
139
-
140
-
141
-
142
-
143
-
144
-
145
-
146
-
147
-
148
-
149
-
150
-
151
-
152
-
153
-
154
-
155
-
156
-
157
-
158
-
159
-
160
-
161
-
162
-
163
-
164
-
165
-
166
-
167
-
168
-
169
-
170
-
171
-
172
-
173
-
174
-
175
-
176
-
177
-
178
-
179
-
180
-
181
-
182
-
183
-
184
-
185
-
186
-
187
-
188
-
189
-
190
-
191
-
192
-
193
-
194
-
195
-
196
-
197
-
198
-
199
-
200
-
201
-
202
-
203
-
204
-
205
-
206
-
207
-
208
-
209
-
210
-
211
-
212
-
213
 |
 |

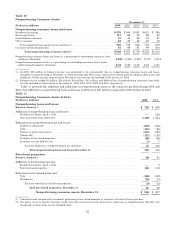
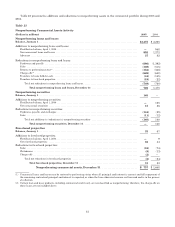
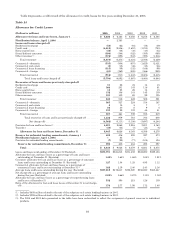
Table 23 presents the additions and reductions to nonperforming assets in the commercial portfolio during 2005 and
2004.
Table 23
Nonperforming Commercial Assets Activity
(Dollars in millions) 2005 2004
Nonperforming loans and leases
Balance, January 1 .................................................................................. $1,475 $ 2,235
Additions to nonperforming loans and leases:
FleetBoston balance, April 1, 2004 ................................................................... —948
New nonaccrual loans and leases .................................................................... 892 1,272
Advances ......................................................................................... 37 82
Reductions in nonperforming loans and leases:
Paydowns and payoffs ............................................................................. (686) (1,392)
Sales ............................................................................................ (108) (515)
Returns to performing status(1) ...................................................................... (152) (348)
Charge-offs(2) ..................................................................................... (669) (640)
Transfers to loans held-for-sale ...................................................................... (44) (145)
Transfers to foreclosed properties ................................................................... (19) (22)
Total net reductions in nonperforming loans and leases ............................................. (749) (760)
Total nonperforming loans and leases, December 31 ...................................... 726 1,475
Nonperforming securities
Balance, January 1 .................................................................................. 140 —
Additions to nonperforming securities:
FleetBoston balance, April 1, 2004 ................................................................... —135
New nonaccrual securities .......................................................................... 15 56
Reductions in nonperforming securities:
Paydowns, payoffs, and exchanges ................................................................... (144) (39)
Sales ............................................................................................ (11) (12)
Total net additions to (reductions in) nonperforming securities ...................................... (140) 140
Total nonperforming securities, December 31 ............................................. —140
Foreclosed properties
Balance, January 1 .................................................................................. 33 67
Additions to foreclosed properties:
FleetBoston balance, April 1, 2004 ................................................................... —9
New foreclosed properties .......................................................................... 32 44
Reductions in foreclosed properties:
Sales ............................................................................................ (24) (74)
Writedowns ...................................................................................... (8) (13)
Charge-offs ....................................................................................... (2) —
Total net reductions in foreclosed properties ...................................................... (2) (34)
Total foreclosed properties, December 31 ................................................. 31 33
Nonperforming commercial assets, December 31 .......................... $ 757 $ 1,648
(1) Commercial loans and leases may be restored to performing status when all principal and interest is current and full repayment of
the remaining contractual principal and interest is expected, or when the loan otherwise becomes well secured and is in the process
of collection.
(2) Certain loan and lease products, including commercial credit card, are not classified as nonperforming; therefore, the charge-offs on
these loans are not included above.
61