Philips 2014 Annual Report Download - page 128
Download and view the complete annual report
Please find page 128 of the 2014 Philips annual report below. You can navigate through the pages in the report by either clicking on the pages listed below, or by using the keyword search tool below to find specific information within the annual report.-
 1
1 -
2
-
3
-
4
-
5
-
6
-
7
-
8
-
9
-
10
-
11
-
12
-
13
-
14
-
15
-
16
-
17
-
18
-
19
-
20
-
21
-
22
-
23
-
24
-
25
-
26
-
27
-
28
-
29
-
30
-
31
-
32
-
33
-
34
-
35
-
36
-
37
-
38
-
39
-
40
-
41
-
42
-
43
-
44
-
45
-
46
-
47
-
48
-
49
-
50
-
51
-
52
-
53
-
54
-
55
-
56
-
57
-
58
-
59
-
60
-
61
-
62
-
63
-
64
-
65
-
66
-
67
-
68
-
69
-
70
-
71
-
72
-
73
-
74
-
75
-
76
-
77
-
78
-
79
-
80
-
81
-
82
-
83
-
84
-
85
-
86
-
87
-
88
-
89
-
90
-
91
-
92
-
93
-
94
-
95
-
96
-
97
-
98
-
99
-
100
-
101
-
102
-
103
-
104
-
105
-
106
-
107
-
108
-
109
-
110
-
111
-
112
-
113
-
114
-
115
-
116
-
117
-
 118
118 -
 119
119 -
 120
120 -
 121
121 -
 122
122 -
 123
123 -
 124
124 -
 125
125 -
 126
126 -
 127
127 -
 128
128 -
 129
129 -
 130
130 -
 131
131 -
 132
132 -
 133
133 -
 134
134 -
 135
135 -
 136
136 -
 137
137 -
 138
138 -
139
-
140
-
141
-
142
-
143
-
144
-
145
-
146
-
147
-
148
-
149
-
150
-
151
-
152
-
153
-
154
-
155
-
156
-
157
-
158
-
159
-
160
-
161
-
162
-
163
-
164
-
165
-
166
-
167
-
168
-
169
-
170
-
171
-
172
-
173
-
174
-
175
-
176
-
177
-
178
-
179
-
180
-
181
-
182
-
183
-
184
-
185
-
186
-
187
-
188
-
189
-
190
-
191
-
192
-
193
-
194
-
195
-
196
-
197
-
198
-
199
-
200
-
201
-
202
-
203
-
204
-
205
-
206
-
207
-
208
-
209
-
210
-
211
-
212
-
213
-
214
-
215
-
216
-
217
-
218
-
219
-
220
-
221
-
222
-
223
-
224
-
225
-
226
-
227
-
228
-
229
-
230
-
231
-
232
-
233
-
234
-
235
-
236
-
237
-
238
-
239
-
240
-
241
-
242
-
243
-
244
 |
 |

Group nancial statements 12.9
128 Annual Report 2014
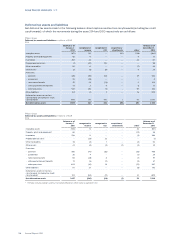
Philips Group
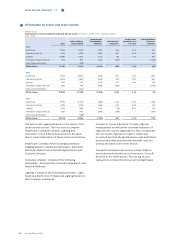
Main countries in millions of EUR
2012 - 2014
sales1) tangible and intangible assets
2014
Netherlands 594 937
United States 6,160 7,649
China 2,362 1,135
Germany 1,351 153
Japan 908 379
France 839 52
United Kingdom 722 594
Other countries 8,455 1,722
Total main countries 21,391 12,621
Assets classied as held for sale 989
Total tangible and intangible assets 13,610
20132)
Netherlands 649 915
United States 6,325 7,384
China 2,616 1,057
Germany 1,316 288
Japan 943 401
France 890 80
United Kingdom 677 573
Other countries 8,574 1,848
Total main countries 21,990 12,546
Assets classied as held for sale 62
Total tangible and intangible assets 12,608
20122)
Netherlands 619 886
United States 6,733 8,007
China 2,391 1,114
Germany 1,277 271
Japan 1,068 537
France 920 90
United Kingdom 664 628
Other countries 8,562 2,105
Total main countries 22,234 13,638
Assets classied as held for sale 6
Total tangible and intangible assets 13,644
1) The sales are reported based on country of destination.
2) The previous years’ presentation reects the sales and tangible and intangible assets of the main countries of 2014 for the respective years.