Philips 2014 Annual Report Download - page 191
Download and view the complete annual report
Please find page 191 of the 2014 Philips annual report below. You can navigate through the pages in the report by either clicking on the pages listed below, or by using the keyword search tool below to find specific information within the annual report.-
 1
1 -
2
-
3
-
4
-
5
-
6
-
7
-
8
-
9
-
10
-
11
-
12
-
13
-
14
-
15
-
16
-
17
-
18
-
19
-
20
-
21
-
22
-
23
-
24
-
25
-
26
-
27
-
28
-
29
-
30
-
31
-
32
-
33
-
34
-
35
-
36
-
37
-
38
-
39
-
40
-
41
-
42
-
43
-
44
-
45
-
46
-
47
-
48
-
49
-
50
-
51
-
52
-
53
-
54
-
55
-
56
-
57
-
58
-
59
-
60
-
61
-
62
-
63
-
64
-
65
-
66
-
67
-
68
-
69
-
70
-
71
-
72
-
73
-
74
-
75
-
76
-
77
-
78
-
79
-
80
-
81
-
82
-
83
-
84
-
85
-
86
-
87
-
88
-
89
-
90
-
91
-
92
-
93
-
94
-
95
-
96
-
97
-
98
-
99
-
100
-
101
-
102
-
103
-
104
-
105
-
106
-
107
-
108
-
109
-
110
-
111
-
112
-
113
-
114
-
115
-
116
-
117
-
118
-
119
-
120
-
121
-
122
-
123
-
124
-
125
-
126
-
127
-
128
-
129
-
130
-
131
-
132
-
133
-
134
-
135
-
136
-
137
-
138
-
139
-
140
-
141
-
142
-
143
-
144
-
145
-
146
-
147
-
148
-
149
-
150
-
151
-
152
-
153
-
154
-
155
-
156
-
157
-
158
-
159
-
160
-
161
-
162
-
163
-
164
-
165
-
166
-
167
-
168
-
169
-
170
-
171
-
172
-
173
-
174
-
175
-
176
-
177
-
178
-
179
-
180
-
 181
181 -
 182
182 -
 183
183 -
 184
184 -
 185
185 -
 186
186 -
 187
187 -
 188
188 -
 189
189 -
 190
190 -
 191
191 -
 192
192 -
 193
193 -
 194
194 -
 195
195 -
 196
196 -
 197
197 -
 198
198 -
 199
199 -
 200
200 -
 201
201 -
202
-
203
-
204
-
205
-
206
-
207
-
208
-
209
-
210
-
211
-
212
-
213
-
214
-
215
-
216
-
217
-
218
-
219
-
220
-
221
-
222
-
223
-
224
-
225
-
226
-
227
-
228
-
229
-
230
-
231
-
232
-
233
-
234
-
235
-
236
-
237
-
238
-
239
-
240
-
241
-
242
-
243
-
244
 |
 |
Sustainability statements 14
Annual Report 2014 191
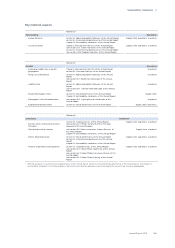
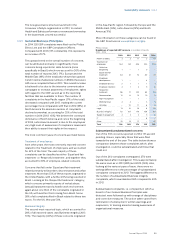
Supplier audits
Supplier audits are primarily focused on identied risk
suppliers, based on identied risk countries and on
spend of more than EUR 1 million (new suppliers EUR
100,000 and no threshold for high risk suppliers).
▪Based on the Maplecroft Human Rights Risk Indexes,
risk countries for Supply Management in 2014 were:
Brazil, China, India, Indonesia, Mexico, Ukraine, and
Russia.
▪Suppliers of new ventures are included to the extent
that the integration process of these ventures has
been nalized. Normative integration period is two
years after closure of the new venture.
Green Products
Green Products oer a signicant environmental
improvement in one or more Green Focal Areas: Energy
eciency, Packaging, Hazardous substances, Weight,
Recycling and disposal and Lifetime reliability. The life
cycle approach is used to determine a product’s overall
environmental improvement. It calculates the
environmental impact of a product over its total life
cycle (raw materials, manufacturing, product use and
disposal).
Green Products need to prove leadership in at least one
Green Focal Area compared to industry standards,
which is dened by a sector specic peer group. This is
done either by outperforming reference products
(which can be a competitor or predecessor product in
the particular product family) by at least 10%,
outperforming product-specic eco-requirements or
by being awarded with a recognized eco-performance
label. Because of dierent product portfolios, sectors
have specied additional criteria for Green Products,
including product-specic minimum requirements
where relevant.
Green Innovation
Green Innovation comprise all R&D activities directly
contributing to the development of Green Products or
Green Technologies. A wide set of additional criteria
and boundaries have been dened as the basis for
internal and external validation.
Environmental data
All environmental data from manufacturing operations
are reported on a half-year basis in our sustainability
reporting and validation tool, according to dened
company guidelines that include denitions,
procedures and calculation methods.
Internal validation processes have been implemented
and peer audits performed to ensure consistent data
quality and to assess the robustness of data reporting
systems.
These environmental data from manufacturing are
tracked and reported to measure progress against our
Green Operations program targets.
Reporting on ISO 14001 certication is based on
manufacturing units reporting in the sustainability
reporting system.
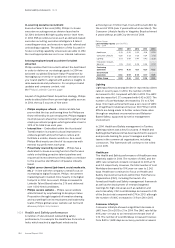
Operational carbon footprint
The Philips operational carbon footprint (Scope 1, 2 and
3) is calculated on a half-yearly basis and includes:
• Industrial sites – manufacturing and assembly sites
•Non-industrial sites – oces, warehouses, IT centers
and R&D facilities
• Business travel – lease and rental cars and airplane
travel
• Logistics – air, sea and road transport
All emission factors used to transform input data (for
example, amount of tonne-kilometers transported) into
CO2 emissions are from the Greenhouse Gas Protocol
(GHGP), except for business travel, where the service
providers supplied CO2 data based on their own veried
methodology. The GHGP distinguishes three scopes. It
is mandatory to report on the rst two to comply with
the GHGP reporting standards.
• Scope 1 – direct CO2 emissions – is reported on with
direct emissions from our industrial and non-
industrial sites in full. Emissions from industrial sites,
which consist of direct emissions resulting from
processes and fossil fuel combustion on site, are
reported in the sustainability reporting system.
Energy use and CO2 emissions from non-industrial
sites are based on actual data where available. If this
is not the case, they are estimated based on square
meters, taking the geographical location and building
type of the site into account.
•Scope 2 – CO2 emissions resulting from the generation
of purchased electricity for our premises – is reported
on with electricity use from industrial and non-
industrial sites in full. Indirect CO2 emissions resulting
from purchased electricity, steam and heat are reported
in the sustainability reporting system. Those emissions
of industrial sites not yet reporting are calculated on the
same basis as described in Scope 1. Indirect emissions
of non-industrial sites are calculated in the same
manner as described in Scope 1.
• Scope 3 – other CO2 emissions related to activities
not owned or controlled by the Group is reported on
for our business travel and distribution activities.
Commuting by our employees, upstream distribution
(before suppliers ship to us), outsourced activities
and emissions resulting from product use by our
customers are not included in our operational carbon
footprint. The calculations for business travel by
lease cars are based on actual fuel usage and for
rental cars on distance traveled. Taxis and chaueur
driven cars used for business travel are not included
in the calculations. Emissions from business travel by
airplane are calculated by the supplier based on
mileage own and emission factors from DEFRA,
distinguishing between short, medium and long