Philips 2014 Annual Report Download - page 229
Download and view the complete annual report
Please find page 229 of the 2014 Philips annual report below. You can navigate through the pages in the report by either clicking on the pages listed below, or by using the keyword search tool below to find specific information within the annual report.-
 1
1 -
2
-
3
-
4
-
5
-
6
-
7
-
8
-
9
-
10
-
11
-
12
-
13
-
14
-
15
-
16
-
17
-
18
-
19
-
20
-
21
-
22
-
23
-
24
-
25
-
26
-
27
-
28
-
29
-
30
-
31
-
32
-
33
-
34
-
35
-
36
-
37
-
38
-
39
-
40
-
41
-
42
-
43
-
44
-
45
-
46
-
47
-
48
-
49
-
50
-
51
-
52
-
53
-
54
-
55
-
56
-
57
-
58
-
59
-
60
-
61
-
62
-
63
-
64
-
65
-
66
-
67
-
68
-
69
-
70
-
71
-
72
-
73
-
74
-
75
-
76
-
77
-
78
-
79
-
80
-
81
-
82
-
83
-
84
-
85
-
86
-
87
-
88
-
89
-
90
-
91
-
92
-
93
-
94
-
95
-
96
-
97
-
98
-
99
-
100
-
101
-
102
-
103
-
104
-
105
-
106
-
107
-
108
-
109
-
110
-
111
-
112
-
113
-
114
-
115
-
116
-
117
-
118
-
119
-
120
-
121
-
122
-
123
-
124
-
125
-
126
-
127
-
128
-
129
-
130
-
131
-
132
-
133
-
134
-
135
-
136
-
137
-
138
-
139
-
140
-
141
-
142
-
143
-
144
-
145
-
146
-
147
-
148
-
149
-
150
-
151
-
152
-
153
-
154
-
155
-
156
-
157
-
158
-
159
-
160
-
161
-
162
-
163
-
164
-
165
-
166
-
167
-
168
-
169
-
170
-
171
-
172
-
173
-
174
-
175
-
176
-
177
-
178
-
179
-
180
-
181
-
182
-
183
-
184
-
185
-
186
-
187
-
188
-
189
-
190
-
191
-
192
-
193
-
194
-
195
-
196
-
197
-
198
-
199
-
200
-
201
-
202
-
203
-
204
-
205
-
206
-
207
-
208
-
209
-
210
-
211
-
212
-
213
-
214
-
215
-
216
-
217
-
218
-
 219
219 -
 220
220 -
 221
221 -
 222
222 -
 223
223 -
 224
224 -
 225
225 -
 226
226 -
 227
227 -
 228
228 -
 229
229 -
 230
230 -
 231
231 -
 232
232 -
 233
233 -
 234
234 -
 235
235 -
 236
236 -
 237
237 -
 238
238 -
 239
239 -
240
-
241
-
242
-
243
-
244
 |
 |

Five-year overview 16
Annual Report 2014 229
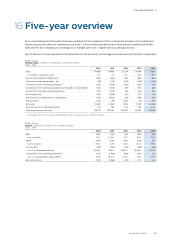
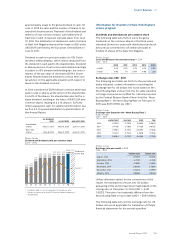
16 Five-year overview
Prior-period nancial information has been restated for the treatment of the combined businesses of Lumileds and
Automotive as discontinued operations (see note 3, Discontinued operations and other assets classied as held for
sale) and for two voluntary accounting policy changes (see note 1, Signicant accounting policies).
Due to factors such as acquisitions and divestments, the amounts, percentages and ratios are not directly comparable.
Philips Group
General data in millions of EUR unless otherwise stated
2010 - 2014
2010 2011 2012 2013 2014
Sales 19,299 19,918 22,234 21,990 21,391
% increase over previous year 11% 3% 12% (1)% (3)%
Income from operations (EBIT) (loss) 1,569 (542) 592 1,855 486
Financial income and expenses - net (175) (331) (329) (330) (301)
Income (loss) from continuing operations 1,051 (1,106) (166) 1,034 221
Income (loss) from continuing operations attributable to shareholders 1,045 (1,110) (171) 1,031 225
Income (loss) from discontinued operations 250 (350) 136 138 190
Net income (loss) 1,301 (1,456) (30) 1,172 411
Net income (loss) attributable to shareholders 1,295 (1,460) (35) 1,169 415
Free cash ow 1,148 (53) 1,645 82 497
Net assets 15,067 12,362 11,185 11,227 10,968
Turnover rate of net operating capital1) 1.52 1.81 2.22 2.39 2.30
Total employees at year-end 119,775 125,240 118,087 116,082 113,678
1) Calculated based upon the values excluding the businesses restated to discontinued operations.
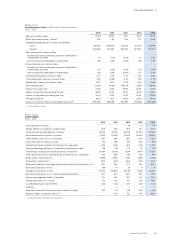
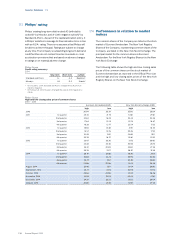
Philips Group
Income in millions of EUR unless otherwise stated
2010 - 2014
2010 2011 2012 2013 2014
EBIT 1,569 (542) 592 1,855 486
as a % of sales 8.1% (2.7)% 2.7% 8.4% 2.3%
EBITA 1,979 1,334 1,003 2,276 821
as a % of sales 10.3% 6.7% 4.5% 10.4% 3.8%
Income taxes (361) (248) (218) (466) (26)
as a % of income before taxes (25.9)% 28.4% (82.9)% (30.6)% (14.1)%
Income (loss) from continuing operations 1,051 (1,106) (166) 1,034 221
as a % of shareholders’ equity (ROE) 6.9% (8.2)% (1.4)% 9.4% 2.0%
Net income (loss) 1,301 (1,456) (30) 1,172 411