Philips 2014 Annual Report Download - page 42
Download and view the complete annual report
Please find page 42 of the 2014 Philips annual report below. You can navigate through the pages in the report by either clicking on the pages listed below, or by using the keyword search tool below to find specific information within the annual report.-
 1
1 -
2
-
3
-
4
-
5
-
6
-
7
-
8
-
9
-
10
-
11
-
12
-
13
-
14
-
15
-
16
-
17
-
18
-
19
-
20
-
21
-
22
-
23
-
24
-
25
-
26
-
27
-
28
-
29
-
30
-
31
-
 32
32 -
 33
33 -
 34
34 -
 35
35 -
 36
36 -
 37
37 -
 38
38 -
 39
39 -
 40
40 -
 41
41 -
 42
42 -
 43
43 -
 44
44 -
 45
45 -
 46
46 -
 47
47 -
 48
48 -
 49
49 -
 50
50 -
 51
51 -
 52
52 -
53
-
54
-
55
-
56
-
57
-
58
-
59
-
60
-
61
-
62
-
63
-
64
-
65
-
66
-
67
-
68
-
69
-
70
-
71
-
72
-
73
-
74
-
75
-
76
-
77
-
78
-
79
-
80
-
81
-
82
-
83
-
84
-
85
-
86
-
87
-
88
-
89
-
90
-
91
-
92
-
93
-
94
-
95
-
96
-
97
-
98
-
99
-
100
-
101
-
102
-
103
-
104
-
105
-
106
-
107
-
108
-
109
-
110
-
111
-
112
-
113
-
114
-
115
-
116
-
117
-
118
-
119
-
120
-
121
-
122
-
123
-
124
-
125
-
126
-
127
-
128
-
129
-
130
-
131
-
132
-
133
-
134
-
135
-
136
-
137
-
138
-
139
-
140
-
141
-
142
-
143
-
144
-
145
-
146
-
147
-
148
-
149
-
150
-
151
-
152
-
153
-
154
-
155
-
156
-
157
-
158
-
159
-
160
-
161
-
162
-
163
-
164
-
165
-
166
-
167
-
168
-
169
-
170
-
171
-
172
-
173
-
174
-
175
-
176
-
177
-
178
-
179
-
180
-
181
-
182
-
183
-
184
-
185
-
186
-
187
-
188
-
189
-
190
-
191
-
192
-
193
-
194
-
195
-
196
-
197
-
198
-
199
-
200
-
201
-
202
-
203
-
204
-
205
-
206
-
207
-
208
-
209
-
210
-
211
-
212
-
213
-
214
-
215
-
216
-
217
-
218
-
219
-
220
-
221
-
222
-
223
-
224
-
225
-
226
-
227
-
228
-
229
-
230
-
231
-
232
-
233
-
234
-
235
-
236
-
237
-
238
-
239
-
240
-
241
-
242
-
243
-
244
 |
 |
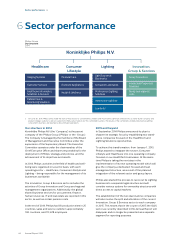
Group performance 5.3.3
42 Annual Report 2014
Philips Group
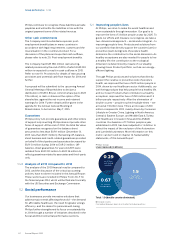
Ratios relating to carbon emissions and energy use
2010 - 2014
2010 2011 2012 2013 2014
Operational CO2 emissions in kilotonnes CO2-equivalent 1,756 1,635 1,441 1,451 1,375
Operational CO2 eciency in tonnes CO2-equivalent per million EUR sales 91 82 65 66 64
Operational energy use in terajoules 28,030 26,570 25,052 25,646 24,464
Operational energy eciency in terajoules per million euro sales 1.45 1.33 1.13 1.17 1.14
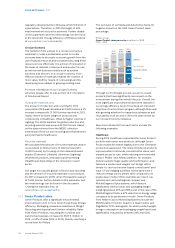
Water
Total water intake in 2014 was 3.1 million m3, about 6%
lower than in 2013. This decrease was mainly due to
lower production volumes at multiple Lighting sites as
well as a signicant reduction at a Consumer Lifestyle
site in China which implemented various water savings
actions. This was partly oset by one Healthcare site
that cooled magnets with water instead of helium.
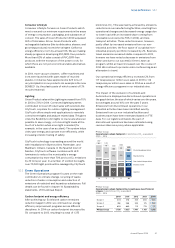
Many Philips sites have water savings programs.
Lighting represents around 66% of total water usage. In
this sector, water is used in manufacturing as well as for
domestic purpose. The other sectors use water mainly
for domestic purposes. The exclusion of Lumileds and
Automotive has a signicant downward impact on the
water consumption of Philips. In 2014, Lumileds and
Automotive accounted for 1.7 million m3 of water.
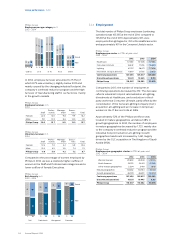
Philips Group
Water intake in thousands of m3
2010 - 2014
2010 2011 2012 2013 2014
Healthcare 256 308 421 454 514
Consumer
Lifestyle 351 338 303 586 537
Lighting 2,282 2,249 2,413 2,249 2,052
Innovation,
Group & Services 7 – – – –
Continuing
operations 2,896 2,895 3,137 3,289 3,103
Discontinued
operations 1,322 1,433 1,720 1,755 1,700
Philips Group 4,218 4,328 4,857 5,044 4,803
In 2014, 72% of water was purchased and 28% was
extracted from groundwater wells.
Waste
In 2014, total waste was comparable to 2013 at 75
kilotonnes. Lighting contributed to 72% of total waste,
Consumer Lifestyle to 15% and Healthcare to 13%.
Waste generated by 8 new reporting sites was oset by
5 discontinued sites. The exclusion of Lumileds and
Automotive had a 7% downward impact on total waste.
In 2013, an Automotive site in the Netherlands reported
10 kilotonnes of demolition scrap.
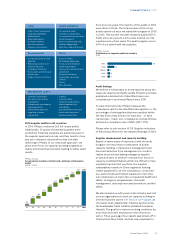
Philips Group
Total waste in kilotonnes
2010 - 2014
2010 2011 2012 2013 2014
Healthcare 11.2 9.3 10.4 9.6 9.8
Consumer
Lifestyle 23.2 19.6 12.7 11.4 11.3
Lighting 61.7 58.1 57.5 54.9 53.9
Innovation,
Group & Services 0.1 – – – –
Continuing
operations 96.2 87.0 80.6 75.9 75.0
Discontinued
operations 8.4 7.0 7.0 16.1 5.4
Philips Group 104.6 94.0 87.6 92.0 80.4
Total waste consists of waste that is delivered for
landll, incineration or recycling. Materials delivered for
recycling via an external contractor comprised 60
kilotonnes, which equals 80% of total waste, an
improvement compared to 79% in 2013, as our
manufacturing sites implemented recycling programs.
Of the 20% remaining waste, 75% comprised non-
hazardous waste and 25% hazardous waste.
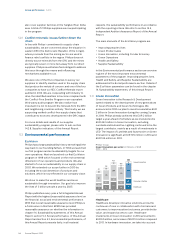
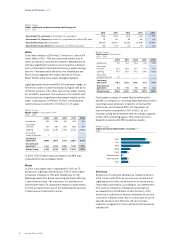
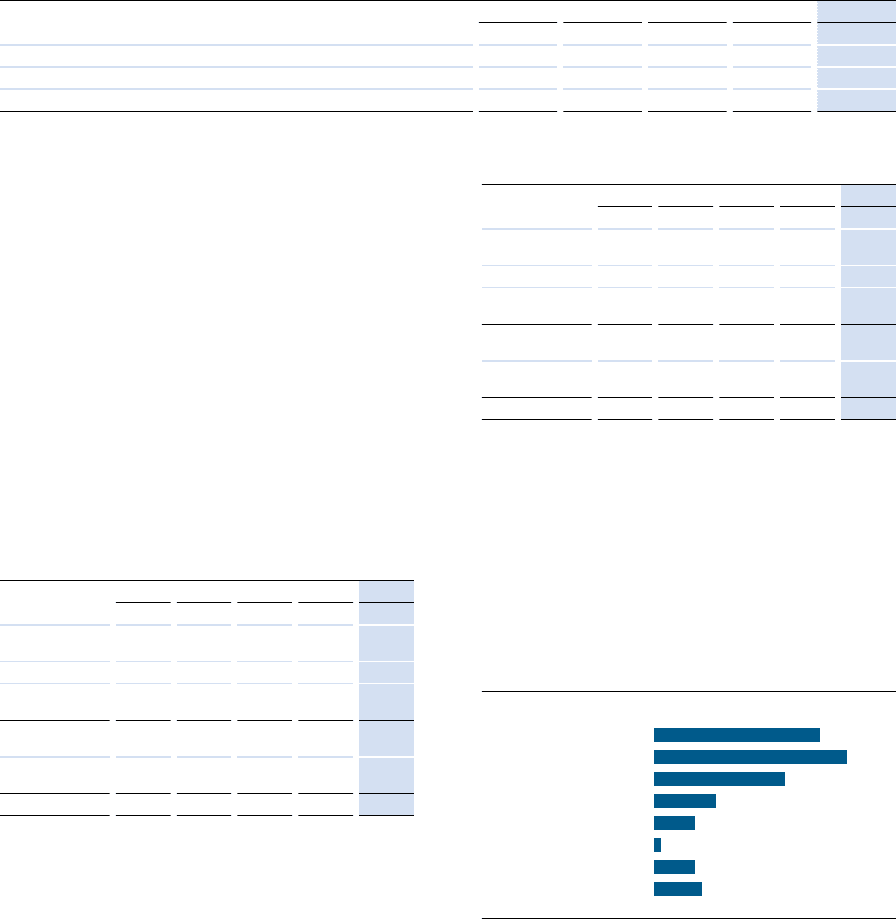
Philips Group
Industrial waste delivered for recycling in %
2014
24Paper
28Glass
19Metal
9Wood
6Plastic
1Demolition scrap
6Waste chemicals
7Other
Emissions
Emissions of restricted substances totaled 9 kilos in
2014, on par with 2013, as our mercury emissions at
Lighting were for the second year in a row as low as
reasonably achievable, according to our assessment.
The level of emissions of hazardous substances
decreased from 35,118 kilos to 28,310 kilos (-19%),
driven by a reduction of Xylene emissions at various
Consumer Lifestyle sites, due to a decrease in use of
specic lacquers and thinners. All sectors have
reduction programs for the restricted and hazardous
substances.