Philips 2014 Annual Report Download - page 228
Download and view the complete annual report
Please find page 228 of the 2014 Philips annual report below. You can navigate through the pages in the report by either clicking on the pages listed below, or by using the keyword search tool below to find specific information within the annual report.-
 1
1 -
2
-
3
-
4
-
5
-
6
-
7
-
8
-
9
-
10
-
11
-
12
-
13
-
14
-
15
-
16
-
17
-
18
-
19
-
20
-
21
-
22
-
23
-
24
-
25
-
26
-
27
-
28
-
29
-
30
-
31
-
32
-
33
-
34
-
35
-
36
-
37
-
38
-
39
-
40
-
41
-
42
-
43
-
44
-
45
-
46
-
47
-
48
-
49
-
50
-
51
-
52
-
53
-
54
-
55
-
56
-
57
-
58
-
59
-
60
-
61
-
62
-
63
-
64
-
65
-
66
-
67
-
68
-
69
-
70
-
71
-
72
-
73
-
74
-
75
-
76
-
77
-
78
-
79
-
80
-
81
-
82
-
83
-
84
-
85
-
86
-
87
-
88
-
89
-
90
-
91
-
92
-
93
-
94
-
95
-
96
-
97
-
98
-
99
-
100
-
101
-
102
-
103
-
104
-
105
-
106
-
107
-
108
-
109
-
110
-
111
-
112
-
113
-
114
-
115
-
116
-
117
-
118
-
119
-
120
-
121
-
122
-
123
-
124
-
125
-
126
-
127
-
128
-
129
-
130
-
131
-
132
-
133
-
134
-
135
-
136
-
137
-
138
-
139
-
140
-
141
-
142
-
143
-
144
-
145
-
146
-
147
-
148
-
149
-
150
-
151
-
152
-
153
-
154
-
155
-
156
-
157
-
158
-
159
-
160
-
161
-
162
-
163
-
164
-
165
-
166
-
167
-
168
-
169
-
170
-
171
-
172
-
173
-
174
-
175
-
176
-
177
-
178
-
179
-
180
-
181
-
182
-
183
-
184
-
185
-
186
-
187
-
188
-
189
-
190
-
191
-
192
-
193
-
194
-
195
-
196
-
197
-
198
-
199
-
200
-
201
-
202
-
203
-
204
-
205
-
206
-
207
-
208
-
209
-
210
-
211
-
212
-
213
-
214
-
215
-
216
-
217
-
 218
218 -
 219
219 -
 220
220 -
 221
221 -
 222
222 -
 223
223 -
 224
224 -
 225
225 -
 226
226 -
 227
227 -
 228
228 -
 229
229 -
 230
230 -
 231
231 -
 232
232 -
 233
233 -
 234
234 -
 235
235 -
 236
236 -
 237
237 -
 238
238 -
239
-
240
-
241
-
242
-
243
-
244
 |
 |

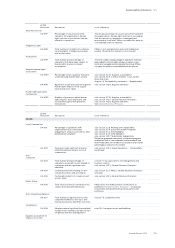
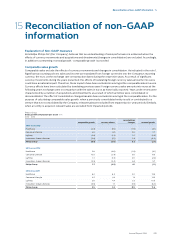
Reconciliation of non-GAAP information 15
228 Annual Report 2014
Net debt
Net debt is dened as the sum of long- and short-term debt minus cash and cash equivalents. The net debt position as
a percentage of the sum of group equity (shareholders’ equity and non-controlling interests) and net debt is presented
to express the nancial strength of the Company. This measure is widely used by management and investment analysts
and is therefore included in the disclosure.
Philips Group
Composition of net debt to group equity in millions of EUR unless otherwise stated
2012 - 2014
2012 2013 2014
Long-term debt 3,725 3,309 3,712
Short-term debt 809 592 392
Total debt 4,534 3,901 4,104
Cash and cash equivalents 3,834 2,465 1,873
Net debt1) 700 1,436 2,231
Shareholders’ equity 11,151 11,214 10,867
Non-controlling interests 34 13 101
Group equity 11,185 11,227 10,968
Net debt and group equity 11,885 12,663 13,199
Net debt divided by net debt and group equity (in %) 6% 11% 17%
Group equity divided by net debt and group equity (in %) 94% 89% 83%
1) Total debt less cash and cash equivalents.
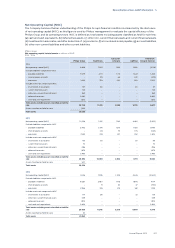
Free Cash Flow
Cash ows before nancing activities, being the sum total of net cash from operating activities and net cash from
investing activities, and free cash ow, being net cash from operating activities minus net capital expenditures, are
presented separately to facilitate the reader’s understanding of the Company’s funding requirements.
Net capital expenditures comprise of purchase of intangible assets, proceeds from sale of intangible assets,
expenditures on development assets, capital expenditures on property, plant and equipment and proceeds from
disposals of property, plant and equipment. This measure is widely used by management to calculate free cash ow.
Philips Group
Free cash ow in millions of EUR
2012 - 2014
2012 2013 2014
Cash ows from operating activities 1,886 912 1,303
Cash ows from investing activities (712) (862) (984)
Cash ows before nancing activities 1,174 50 319
Cash ows from operating activities 1,886 912 1,303
Net capital expenditures: (241) (830) (806)
Purchase of intangible assets (33) (49) (114)
Proceeds from sale of intangible assets 160 – –
Expenditures on development assets (311) (326) (295)
Capital expenditures on property, plant and equipment (479) (482) (437)
Proceeds from disposals of property, plant and equipment 422 27 40
Free cash ow 1,645 82 497
Adjustments
Prior-period nancial information has been restated for the treatment of the combined businesses of Lumileds and
Automotive as discontinued operations (see note 3, Discontinued operations and other assets classied as held for
sale) and for two voluntary accounting policy changes (see note 1, Signicant accounting policies).