Philips 2014 Annual Report Download - page 237
Download and view the complete annual report
Please find page 237 of the 2014 Philips annual report below. You can navigate through the pages in the report by either clicking on the pages listed below, or by using the keyword search tool below to find specific information within the annual report.-
 1
1 -
2
-
3
-
4
-
5
-
6
-
7
-
8
-
9
-
10
-
11
-
12
-
13
-
14
-
15
-
16
-
17
-
18
-
19
-
20
-
21
-
22
-
23
-
24
-
25
-
26
-
27
-
28
-
29
-
30
-
31
-
32
-
33
-
34
-
35
-
36
-
37
-
38
-
39
-
40
-
41
-
42
-
43
-
44
-
45
-
46
-
47
-
48
-
49
-
50
-
51
-
52
-
53
-
54
-
55
-
56
-
57
-
58
-
59
-
60
-
61
-
62
-
63
-
64
-
65
-
66
-
67
-
68
-
69
-
70
-
71
-
72
-
73
-
74
-
75
-
76
-
77
-
78
-
79
-
80
-
81
-
82
-
83
-
84
-
85
-
86
-
87
-
88
-
89
-
90
-
91
-
92
-
93
-
94
-
95
-
96
-
97
-
98
-
99
-
100
-
101
-
102
-
103
-
104
-
105
-
106
-
107
-
108
-
109
-
110
-
111
-
112
-
113
-
114
-
115
-
116
-
117
-
118
-
119
-
120
-
121
-
122
-
123
-
124
-
125
-
126
-
127
-
128
-
129
-
130
-
131
-
132
-
133
-
134
-
135
-
136
-
137
-
138
-
139
-
140
-
141
-
142
-
143
-
144
-
145
-
146
-
147
-
148
-
149
-
150
-
151
-
152
-
153
-
154
-
155
-
156
-
157
-
158
-
159
-
160
-
161
-
162
-
163
-
164
-
165
-
166
-
167
-
168
-
169
-
170
-
171
-
172
-
173
-
174
-
175
-
176
-
177
-
178
-
179
-
180
-
181
-
182
-
183
-
184
-
185
-
186
-
187
-
188
-
189
-
190
-
191
-
192
-
193
-
194
-
195
-
196
-
197
-
198
-
199
-
200
-
201
-
202
-
203
-
204
-
205
-
206
-
207
-
208
-
209
-
210
-
211
-
212
-
213
-
214
-
215
-
216
-
217
-
218
-
219
-
220
-
221
-
222
-
223
-
224
-
225
-
226
-
 227
227 -
 228
228 -
 229
229 -
 230
230 -
 231
231 -
 232
232 -
 233
233 -
 234
234 -
 235
235 -
 236
236 -
 237
237 -
 238
238 -
 239
239 -
 240
240 -
 241
241 -
 242
242 -
 243
243 -
 244
244
 |
 |

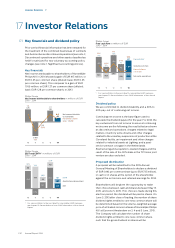
Investor Relations 17.4
Annual Report 2014 237
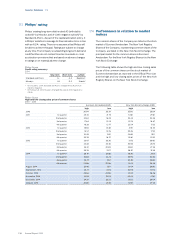
Euronext Amsterdam
Philips Group
Share price development in Amsterdam in EUR
2013 - 2014
PHIA Jan Feb Mar Apr May Jun Jul Aug Sep Oct Nov Dec
2014
High 28.10 26.47 25.86 25.86 23.64 24.22 23.82 23.46 25.27 24.68 24.26 24.37
Low 25.52 25.09 23.88 22.98 22.43 22.22 23.08 22.11 23.12 20.98 22.05 22.52
Average 27.17 25.79 24.82 24.66 23.21 23.13 23.37 22.82 23.89 22.51 22.91 23.78
Average daily
volume1) 6.23 5.55 6.52 6.94 5.66 5.38 5.03 4.07 5.94 7.75 5.74 5.74
2013
High 23.13 23.31 23.67 23.48 22.90 21.81 24.41 24.58 25.32 26.08 26.50 26.78
Low 20.26 21.23 21.56 20.54 20.45 20.36 20.89 22.90 23.83 23.17 25.70 24.64
Average 21.34 22.26 22.93 22.15 21.97 21.29 22.81 24.00 24.54 24.68 26.14 25.81
Average daily
volume1) 5.50 6.11 6.09 6.57 6.17 5.90 5.33 3.81 6.32 5.41 3.90 4.99
1) In millions of shares
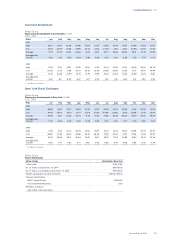
New York Stock Exchange
Philips Group
Share price development in New York in USD
2013 - 2014
PHG Jan Feb Mar Apr May Jun Jul Aug Sep Oct Nov Dec
2014
High 38.36 36.15 35.37 35.95 32.32 32.75 32.39 31.04 32.08 31.02 30.05 30.12
Low 34.61 34.04 33.13 31.75 31.08 30.35 30.80 29.80 30.14 26.36 27.61 28.04
Average 36.86 35.11 34.26 34.05 31.78 31.44 31.68 30.38 30.80 28.52 28.50 29.24
Average daily
volume1) 0.70 0.56 0.49 0.57 0.48 0.69 0.93 0.55 0.77 0.78 0.60 0.57
2013
High 31.16 31.72 30.72 30.65 29.21 29.19 32.47 32.45 33.60 35.69 35.76 36.97
Low 26.60 27.82 28.23 26.88 26.75 26.94 27.28 30.62 31.57 31.36 34.81 33.92
Average 28.41 29.68 29.71 28.84 28.37 28.12 29.91 31.92 32.86 33.63 35.22 35.48
Average daily
volume1) 0.85 0.77 0.82 0.77 0.80 0.93 0.86 0.44 0.66 0.66 0.39 0.39
1) In millions of shares
Philips Group
Share information
Share listings Amsterdam, New York
Ticker code PHIA, PHG
No. of shares issued at Dec. 31, 2014 935 million
No. of shares outstanding issued at Dec. 31, 2014 914 million
Market capitalization at year-end 2014 EUR 22.1 billion
Industry classication
MSCI: Capital Goods 20105010
ICB: Diversied Industrials 2727
Members of indices
AEX, NYSE, DJSI, and others