Philips 2014 Annual Report Download - page 47
Download and view the complete annual report
Please find page 47 of the 2014 Philips annual report below. You can navigate through the pages in the report by either clicking on the pages listed below, or by using the keyword search tool below to find specific information within the annual report.-
 1
1 -
2
-
3
-
4
-
5
-
6
-
7
-
8
-
9
-
10
-
11
-
12
-
13
-
14
-
15
-
16
-
17
-
18
-
19
-
20
-
21
-
22
-
23
-
24
-
25
-
26
-
27
-
28
-
29
-
30
-
31
-
32
-
33
-
34
-
35
-
36
-
 37
37 -
 38
38 -
 39
39 -
 40
40 -
 41
41 -
 42
42 -
 43
43 -
 44
44 -
 45
45 -
 46
46 -
 47
47 -
 48
48 -
 49
49 -
 50
50 -
 51
51 -
 52
52 -
 53
53 -
 54
54 -
 55
55 -
 56
56 -
 57
57 -
58
-
59
-
60
-
61
-
62
-
63
-
64
-
65
-
66
-
67
-
68
-
69
-
70
-
71
-
72
-
73
-
74
-
75
-
76
-
77
-
78
-
79
-
80
-
81
-
82
-
83
-
84
-
85
-
86
-
87
-
88
-
89
-
90
-
91
-
92
-
93
-
94
-
95
-
96
-
97
-
98
-
99
-
100
-
101
-
102
-
103
-
104
-
105
-
106
-
107
-
108
-
109
-
110
-
111
-
112
-
113
-
114
-
115
-
116
-
117
-
118
-
119
-
120
-
121
-
122
-
123
-
124
-
125
-
126
-
127
-
128
-
129
-
130
-
131
-
132
-
133
-
134
-
135
-
136
-
137
-
138
-
139
-
140
-
141
-
142
-
143
-
144
-
145
-
146
-
147
-
148
-
149
-
150
-
151
-
152
-
153
-
154
-
155
-
156
-
157
-
158
-
159
-
160
-
161
-
162
-
163
-
164
-
165
-
166
-
167
-
168
-
169
-
170
-
171
-
172
-
173
-
174
-
175
-
176
-
177
-
178
-
179
-
180
-
181
-
182
-
183
-
184
-
185
-
186
-
187
-
188
-
189
-
190
-
191
-
192
-
193
-
194
-
195
-
196
-
197
-
198
-
199
-
200
-
201
-
202
-
203
-
204
-
205
-
206
-
207
-
208
-
209
-
210
-
211
-
212
-
213
-
214
-
215
-
216
-
217
-
218
-
219
-
220
-
221
-
222
-
223
-
224
-
225
-
226
-
227
-
228
-
229
-
230
-
231
-
232
-
233
-
234
-
235
-
236
-
237
-
238
-
239
-
240
-
241
-
242
-
243
-
244
 |
 |

Sector performance 6.1.3
Annual Report 2014 47
capabilities, we focused on creating value across our
businesses and markets through collaborative
innovation, including:
•Large-scale partnerships – We entered into a
number of strategic, multi-year agreements that
address government and health system goals of
improving population health and delivering quality
care more eectively. These included a 15-year
contract with Reinier de Graaf Hospital in the
Netherlands, a 14-year contract with Karolinska
University Hospital and the Stockholm County
Council in Sweden, and a 10-year contract related to
the 700-bed Philippine Orthopedic Centre in the
Philippines.
•Co-created solutions – We collaborated on smart
solutions co-created in the clinical environment, such
as working with the University of Washington on
advancements in diagnostics and informatics to
improve outcomes, drive operational eciency and
reduce costs per patient.
•Strategic alliances – We formed key partnerships to
help drive healthcare transformation, including an
alliance with Salesforce.com to deliver an open,
cloud-based healthcare platform that will enable
collaborative care management between patients
and healthcare professionals.
We also introduced locally relevant solutions for
making quality care accessible to wider patient
populations in markets such as India and Africa. These
innovations included VISIQ, an ultra-mobile, tablet-
based system for ultrasound imaging, and Ecia
DFM100, an integrated debrillator and monitor
solution.
We are proud that customers named Philips Healthcare
as the overall Best in KLAS Imaging Equipment
Company in 2014 for the second year in a row.
In 2014, we entered the fourth year of our Accelerate!
journey, which continued to drive improvements in
operational performance, as we focused on
strengthening our innovation pipeline while making
progress on cost savings.
In December 2014 Philips entered into an agreement to
acquire Volcano Corporation, a global leader in
catheter-based imaging and measurement solutions
for cardiovascular applications. Volcano’s
complementary portfolio and expertise will create
opportunities to accelerate revenue growth for our
image-guided therapy business.
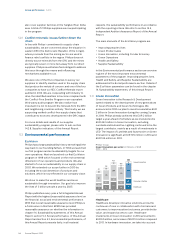
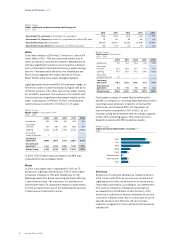
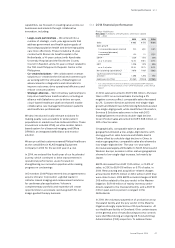
6.1.4 2014 nancial performance
Philips Healthcare
Key data in millions of EUR unless otherwise stated
2012 - 2014
2012 2013 2014
Sales 9,983 9,575 9,186
Sales growth
% increase (decrease), nominal 13% (4)% (4)%
% increase (decrease),
comparable1) 6% 1% (2)%
EBITA 1) 1,226 1,512 616
as a % of sales 12.3% 15.8% 6.7%
EBIT 1,026 1,315 456
as a % of sales 10.3% 13.7% 5.0%
Net operating capital (NOC)1) 7,976 7,437 7,565
Cash ows before nancing
activities1) 1,298 1,292 910
Employees (in FTEs) 37,460 37,008 37,065
1) For a reconciliation to the most directly comparable GAAP measures,
see chapter 15, Reconciliation of non-GAAP information, of this Annual
Report
In 2014, sales amounted to EUR 9,186 million, 4% lower
than in 2013 on a nominal basis. Excluding a 2%
negative currency eect, comparable sales decreased
by 2%. Customer Services achieved mid-single-digit
growth and Patient Care & Monitoring Solutions posted
low-single-digit growth, while HealthCare Informatics,
Services & Solutions sales were in line with 2013.
Imaging Systems recorded a double-digit decline.
Green Product sales amounted to EUR 3,508 million, or
38% of sector sales.
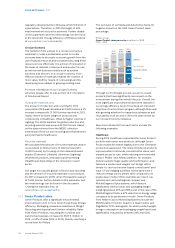
Geographically, comparable sales in growth
geographies showed a low-single-digit decline, with
strong growth in Latin America and Middle East &
Turkey oset by a double-digit decline in China. In
mature geographies, comparable sales also showed a
low-single-digit decline. The year-on-year sales
decrease was largely attributable to North America and
Western Europe, as sales in other mature geographies
showed a low-single-digit increase, led mainly by
Japan.
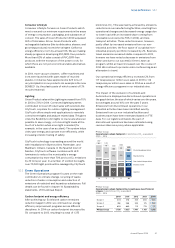
EBITA decreased from EUR 1,512 million, or 15.8% of
sales, in 2013 to EUR 616 million, or 6.7% of sales, in
2014. Restructuring and acquisition-related charges
amounted to EUR 70 million in 2014, while in 2013 they
were close to zero. 2014 EBITA included charges of EUR
366 million related to the jury verdict in the Masimo
litigation, EUR 49 million of mainly inventory write-
downs related to the Cleveland facility, and a EUR 16
million past-service pension cost gain in the
Netherlands.
In 2014, the voluntary suspension of production at our
Cleveland facility and the jury verdict in the Masimo
litigation strongly impacted our 2014 performance. At
our Healthcare facility in Cleveland, Ohio, certain issues
in the general area of manufacturing process controls
were identied during an ongoing US Food and Drug
Administration (FDA) inspection. To address these