Philips 2014 Annual Report Download - page 24
Download and view the complete annual report
Please find page 24 of the 2014 Philips annual report below. You can navigate through the pages in the report by either clicking on the pages listed below, or by using the keyword search tool below to find specific information within the annual report.-
 1
1 -
2
-
3
-
4
-
5
-
6
-
7
-
8
-
9
-
10
-
11
-
12
-
13
-
 14
14 -
 15
15 -
 16
16 -
 17
17 -
 18
18 -
 19
19 -
 20
20 -
 21
21 -
 22
22 -
 23
23 -
 24
24 -
 25
25 -
 26
26 -
 27
27 -
 28
28 -
 29
29 -
 30
30 -
 31
31 -
 32
32 -
 33
33 -
 34
34 -
35
-
36
-
37
-
38
-
39
-
40
-
41
-
42
-
43
-
44
-
45
-
46
-
47
-
48
-
49
-
50
-
51
-
52
-
53
-
54
-
55
-
56
-
57
-
58
-
59
-
60
-
61
-
62
-
63
-
64
-
65
-
66
-
67
-
68
-
69
-
70
-
71
-
72
-
73
-
74
-
75
-
76
-
77
-
78
-
79
-
80
-
81
-
82
-
83
-
84
-
85
-
86
-
87
-
88
-
89
-
90
-
91
-
92
-
93
-
94
-
95
-
96
-
97
-
98
-
99
-
100
-
101
-
102
-
103
-
104
-
105
-
106
-
107
-
108
-
109
-
110
-
111
-
112
-
113
-
114
-
115
-
116
-
117
-
118
-
119
-
120
-
121
-
122
-
123
-
124
-
125
-
126
-
127
-
128
-
129
-
130
-
131
-
132
-
133
-
134
-
135
-
136
-
137
-
138
-
139
-
140
-
141
-
142
-
143
-
144
-
145
-
146
-
147
-
148
-
149
-
150
-
151
-
152
-
153
-
154
-
155
-
156
-
157
-
158
-
159
-
160
-
161
-
162
-
163
-
164
-
165
-
166
-
167
-
168
-
169
-
170
-
171
-
172
-
173
-
174
-
175
-
176
-
177
-
178
-
179
-
180
-
181
-
182
-
183
-
184
-
185
-
186
-
187
-
188
-
189
-
190
-
191
-
192
-
193
-
194
-
195
-
196
-
197
-
198
-
199
-
200
-
201
-
202
-
203
-
204
-
205
-
206
-
207
-
208
-
209
-
210
-
211
-
212
-
213
-
214
-
215
-
216
-
217
-
218
-
219
-
220
-
221
-
222
-
223
-
224
-
225
-
226
-
227
-
228
-
229
-
230
-
231
-
232
-
233
-
234
-
235
-
236
-
237
-
238
-
239
-
240
-
241
-
242
-
243
-
244
 |
 |

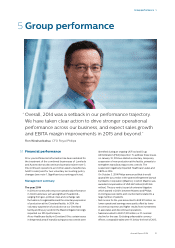
Group performance 5.1.3
24 Annual Report 2014
verdict in the Masimo litigation, EUR 49 million mainly
related to inventory write-downs in the Cleveland
facility, and a EUR 16 million past-service pension cost
gain in the Netherlands. 2013 included a past-service
pension cost gain of EUR 61 million and a gain on the
sale of a business of EUR 21 million. The decline in EBITA
was largely due to operational losses related to the
voluntary suspension of production at the Cleveland
facility and negative currency impacts.
Consumer Lifestyle
EBITA improved from EUR 483 million, or 10.5% of sales,
in 2013 to EUR 573 million, or 12.1% of sales, in 2014. 2014
included restructuring and acquisition-related charges
of EUR 9 million and a EUR 11 million past-service
pension cost gain in the Netherlands. 2013 included
restructuring and acquisition-related charges of EUR 14
million and a past-service pension cost gain of EUR 1
million in the US. The increase was largely driven by
higher sales and operational improvements.
Lighting
EBITA declined from EUR 580 million, or 8.1% of sales,
in 2013 to EUR 293 million, or 4.3% of sales, in 2014.
Restructuring and acquisition-related charges
amounted to EUR 245 million in 2014, compared to EUR
83 million in 2013. 2014 EBITA included EUR 68 million
of impairment and other charges related to industrial
assets and a EUR 13 million past-service pension cost
gain in the Netherlands, while 2013 EBITA included a
past-service pension cost gain of EUR 10 million in the
US. The decrease in EBITA was largely driven by higher
restructuring charges and lower sales volume.
Innovation, Group & Services
EBITA declined from a loss of EUR 299 million in 2013
to a loss of EUR 661 million in 2014. 2014 EBITA included
restructuring and acquisition-related charges of EUR
110 million, provisions of EUR 244 million related to
legal matters and a EUR 27 million gain from a past-
service pension cost gain in the Netherlands. 2013
included restructuring and acquisition-related charges
of EUR 3 million and a pension settlement loss of EUR
25 million. Excluding these items, the year-on-year
EBITA decline was mainly driven by higher investments
in emerging business areas and lower IP income.
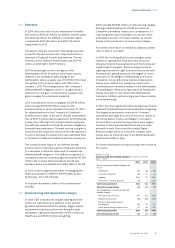
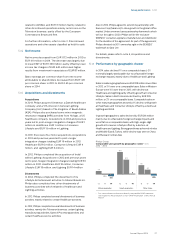
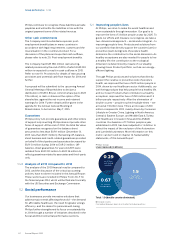
5.1.3 Advertising and promotion
Philips’ total advertising and promotion expenses were
EUR 913 million in 2014, an increase of 5% compared to
2013. The increase was mainly due to investments in
mature markets, such as the Netherlands, Germany and
United States. The advertising and promotion spend in
key growth geographies decreased by 5% compared to
2013, largely due to lower spend in China. The total
advertising and promotion investment as a percentage
of sales was 4.3% in 2014, compared to 4.0% in 2013.
Philips increased its brand value by 5% to over USD 10.3
billion in the 2014 ranking of the world’s 100 most
valuable brands, as measured by Interbrand. In the 2014
listing, Philips is now ranked the 42nd most valuable
brand in the world.
Philips Group
Advertising and promotion expenses in millions of EUR
2010 - 2014
760
‘10
3.9% 852
‘11
4.3%
829
‘12
3.7% 869
‘13
4.0% 913 Advertising and promotion
expenses
‘14
4.3%
As a % of sales
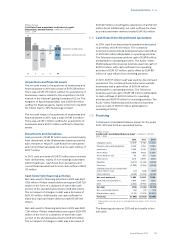
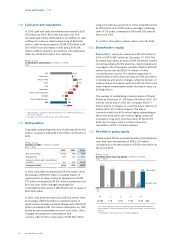
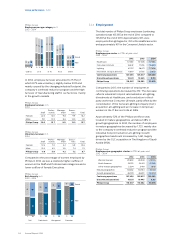
5.1.4 Research and development
Research and development costs decreased from EUR
1,659 million in 2013 to EUR 1,635 million in 2014. 2014
included EUR 34 million of restructuring and
acquisition-related charges, compared to EUR 2 million
in 2013. The year-on-year decrease was driven by IG&S,
partly oset by increases at Healthcare and Lighting. As
a percentage of sales, research and development costs
increased from 7.5% in 2013 to 7.6%.
Philips Group
Research and development expenses in millions of EUR
2010 - 2014
1,436
‘10
7.4% 1,543
‘11
7.7% 1,724
‘12
7.8%
1,659
‘13
7.5%
1,635 Research and development
expenses
‘14
7.6%
As a % of sales
Philips Group
Research and development expenses in millions of EUR
2012 - 2014
2012 2013 2014
Healthcare 858 810 822
Consumer Lifestyle 256 268 263
Lighting 341 313 330
Innovation, Group & Services 269 268 220
Philips Group 1,724 1,659 1,635