Philips 2014 Annual Report Download - page 201
Download and view the complete annual report
Please find page 201 of the 2014 Philips annual report below. You can navigate through the pages in the report by either clicking on the pages listed below, or by using the keyword search tool below to find specific information within the annual report.-
 1
1 -
2
-
3
-
4
-
5
-
6
-
7
-
8
-
9
-
10
-
11
-
12
-
13
-
14
-
15
-
16
-
17
-
18
-
19
-
20
-
21
-
22
-
23
-
24
-
25
-
26
-
27
-
28
-
29
-
30
-
31
-
32
-
33
-
34
-
35
-
36
-
37
-
38
-
39
-
40
-
41
-
42
-
43
-
44
-
45
-
46
-
47
-
48
-
49
-
50
-
51
-
52
-
53
-
54
-
55
-
56
-
57
-
58
-
59
-
60
-
61
-
62
-
63
-
64
-
65
-
66
-
67
-
68
-
69
-
70
-
71
-
72
-
73
-
74
-
75
-
76
-
77
-
78
-
79
-
80
-
81
-
82
-
83
-
84
-
85
-
86
-
87
-
88
-
89
-
90
-
91
-
92
-
93
-
94
-
95
-
96
-
97
-
98
-
99
-
100
-
101
-
102
-
103
-
104
-
105
-
106
-
107
-
108
-
109
-
110
-
111
-
112
-
113
-
114
-
115
-
116
-
117
-
118
-
119
-
120
-
121
-
122
-
123
-
124
-
125
-
126
-
127
-
128
-
129
-
130
-
131
-
132
-
133
-
134
-
135
-
136
-
137
-
138
-
139
-
140
-
141
-
142
-
143
-
144
-
145
-
146
-
147
-
148
-
149
-
150
-
151
-
152
-
153
-
154
-
155
-
156
-
157
-
158
-
159
-
160
-
161
-
162
-
163
-
164
-
165
-
166
-
167
-
168
-
169
-
170
-
171
-
172
-
173
-
174
-
175
-
176
-
177
-
178
-
179
-
180
-
181
-
182
-
183
-
184
-
185
-
186
-
187
-
188
-
189
-
190
-
 191
191 -
 192
192 -
 193
193 -
 194
194 -
 195
195 -
 196
196 -
 197
197 -
 198
198 -
 199
199 -
 200
200 -
 201
201 -
 202
202 -
 203
203 -
 204
204 -
 205
205 -
 206
206 -
 207
207 -
 208
208 -
 209
209 -
 210
210 -
 211
211 -
212
-
213
-
214
-
215
-
216
-
217
-
218
-
219
-
220
-
221
-
222
-
223
-
224
-
225
-
226
-
227
-
228
-
229
-
230
-
231
-
232
-
233
-
234
-
235
-
236
-
237
-
238
-
239
-
240
-
241
-
242
-
243
-
244
 |
 |

Sustainability statements 14.2.8
Annual Report 2014 201
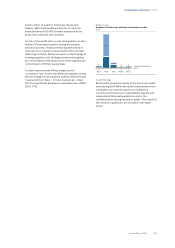
Most frequent areas of non-compliance in 2014
1. Certied Management System (ISO9001, ISO14001,
and OHSAS18001)
2. Emergency Preparedness
3. Working Hours
Positive trends compared to last year
• Working Hours (10% less NCs)
•EICC Code: understanding and commitment of Code
and requirements (5% less NCs)
• Wages and Benets (5% less NCs)
Negative trends compared to last year
We see an increase of 5% in the NCs for the following
areas:
• Protection of Identity
• Food, Sanitation and Housing
• Occupational Injury and Illness
Management systems
There may be areas where our audits reveal compliance
in actual practice, but the related underlying
management systems to safeguard continued
compliance may not be sucient. Therefore, also
management systems are reviewed during the audits.
Although the 2014 audits show improvements
compared to previous years, we see this as a continued
weak area at suppliers where further capacity building
is necessary. Related to management systems the most
frequently observed NCs are:
•Certied management system (missing certicate for
one or more of these systems: ISO9001, ISO14001,
and OHSAS18001)
• Audits and assessments (no regular self-
assessments and follow-up done by supplier)
• Supplier responsibility (EICC Code requirements
have not been communicated to the next tier
suppliers)
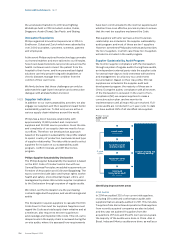
Philips Group
Audit progress and targets
2014 Goals Progress
75% of corrective actions implemented within 90 days (for major NCs found in
2014 audits)
Average NC closure time was around 6 months, mainly due to longer
resolution times for working hour issues. Before closing working hours
NCs Philips requires at least 3 months’ time records
2015 Goals
Improve H&S performance of suppliers with 10%
Implementing corrective actions
On average we see 11 major NCs per supplier audit
(2013: 12) and work with each supplier to resolve these
NCs within 90 days where possible. Goal is to improve
the conditions in the supplier factories. Therefore, we
focus on training, supplier development and
implementation of corrective action plans with those
suppliers. In exceptional cases where the supplier is
unwilling to improve, we will decide to end the business
relationship, which we did for 3 suppliers in 2014.
If Philips notices that there is a delay in the realization
of the corrective action plan by the supplier, Philips uses
a stratied approach for consequence management.
Depending on the root-cause why the supplier is not
taking sucient corrective actions, Philips can decide
to: send a formal warning to the supplier; allocate no
new projects; allocate no new orders; or stop doing
business.
Collaboration Philips, IPE and suppliers
Next to the supplier sustainability audits that we
perform at our suppliers, we also look at insights
from external stakeholders to help monitor the
performance of our suppliers. For example, we
work with the Institute of Public &
Environmental Aairs (IPE) who publishes a
map of Chinese factories linked to water and air
pollution. When we know that one of the
mentioned factories is a Philips supplier, we will
inform that company to implement corrective
actions and will ask IPE to perform a third-party
assessment to verify adequate resolution of the
issues. By working this way, in we eectively
resolved a case of water pollution at a supplier
in Guangdong province, China.
Supplier training and capacity building
Based on many years of experience with the audit
program, we know that a combination of audits,
capacity building, consequence management and
structural attention from management is crucial to
realize structural and lasting changes at supplier
production sites.
We provide classroom training sessions for suppliers,
Philips sustainability experts regularly visit suppliers to
provide on-site consultancy and training, and we invite