Philips 2014 Annual Report Download - page 15
Download and view the complete annual report
Please find page 15 of the 2014 Philips annual report below. You can navigate through the pages in the report by either clicking on the pages listed below, or by using the keyword search tool below to find specific information within the annual report.-
 1
1 -
2
-
3
-
4
-
 5
5 -
 6
6 -
 7
7 -
 8
8 -
 9
9 -
 10
10 -
 11
11 -
 12
12 -
 13
13 -
 14
14 -
 15
15 -
 16
16 -
 17
17 -
 18
18 -
 19
19 -
 20
20 -
 21
21 -
 22
22 -
 23
23 -
 24
24 -
 25
25 -
26
-
27
-
28
-
29
-
30
-
31
-
32
-
33
-
34
-
35
-
36
-
37
-
38
-
39
-
40
-
41
-
42
-
43
-
44
-
45
-
46
-
47
-
48
-
49
-
50
-
51
-
52
-
53
-
54
-
55
-
56
-
57
-
58
-
59
-
60
-
61
-
62
-
63
-
64
-
65
-
66
-
67
-
68
-
69
-
70
-
71
-
72
-
73
-
74
-
75
-
76
-
77
-
78
-
79
-
80
-
81
-
82
-
83
-
84
-
85
-
86
-
87
-
88
-
89
-
90
-
91
-
92
-
93
-
94
-
95
-
96
-
97
-
98
-
99
-
100
-
101
-
102
-
103
-
104
-
105
-
106
-
107
-
108
-
109
-
110
-
111
-
112
-
113
-
114
-
115
-
116
-
117
-
118
-
119
-
120
-
121
-
122
-
123
-
124
-
125
-
126
-
127
-
128
-
129
-
130
-
131
-
132
-
133
-
134
-
135
-
136
-
137
-
138
-
139
-
140
-
141
-
142
-
143
-
144
-
145
-
146
-
147
-
148
-
149
-
150
-
151
-
152
-
153
-
154
-
155
-
156
-
157
-
158
-
159
-
160
-
161
-
162
-
163
-
164
-
165
-
166
-
167
-
168
-
169
-
170
-
171
-
172
-
173
-
174
-
175
-
176
-
177
-
178
-
179
-
180
-
181
-
182
-
183
-
184
-
185
-
186
-
187
-
188
-
189
-
190
-
191
-
192
-
193
-
194
-
195
-
196
-
197
-
198
-
199
-
200
-
201
-
202
-
203
-
204
-
205
-
206
-
207
-
208
-
209
-
210
-
211
-
212
-
213
-
214
-
215
-
216
-
217
-
218
-
219
-
220
-
221
-
222
-
223
-
224
-
225
-
226
-
227
-
228
-
229
-
230
-
231
-
232
-
233
-
234
-
235
-
236
-
237
-
238
-
239
-
240
-
241
-
242
-
243
-
244
 |
 |

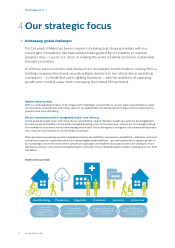
Our strategic focus 4.4
Annual Report 2014 15
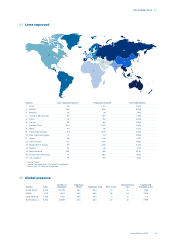
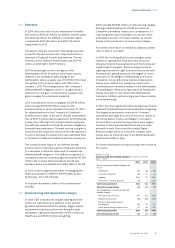
4.4 Lives improved
1
13
9
2
7
16
11
12
15
14
8
10
6
54
3
17
Markets Lives improved (millions)1) Population (millions)2) GDP (USD billions)3)
1. Africa 48 1.137 2.504
2. ASEAN 208 938 5.789
3. Benelux 28 28 1.472
4. Central & East Europe 88 130 1.585
5. DACH 91 98 4.939
6. France 59 66 2.909
7. Greater China 334 1.401 11.626
8. Iberia 44 58 1.633
9. Indian Subcontinent 174 1.476 2.330
10. Italy, Israel and Greece 51 79 2.693
11. Japan 26 126 4.770
12. Latin America 127 500 4.697
13. Middle East & Turkey 95 335 3.445
14. Nordics 26 26 1.722
15. North America 349 478 20.511
16. Russia and Central Asia 81 263 2.623
17. UK & Ireland 49 69 3.105
1) Source: Philips
2) Source: The World Bank, CIA Factbook & Wikipedia
3) Source: IMF, CIA Factbook & Wikipedia
4.5 Global presence
Markets Sales
Number of
employees
Employees
female Employees male R&D centers
Manufacturing
sites
Tangible and
intangible assets
Asia & Pacic 6,226 40,049 36% 64% 10 21 1,796
EMEA 7,261 34,417 32% 68% 28 34 2,916
Latin America 1,226 7,910 46% 54% 2 6 110
North America 6,678 22,989 35% 65% 20 32 7,799