Philips 2014 Annual Report Download - page 158
Download and view the complete annual report
Please find page 158 of the 2014 Philips annual report below. You can navigate through the pages in the report by either clicking on the pages listed below, or by using the keyword search tool below to find specific information within the annual report.-
 1
1 -
2
-
3
-
4
-
5
-
6
-
7
-
8
-
9
-
10
-
11
-
12
-
13
-
14
-
15
-
16
-
17
-
18
-
19
-
20
-
21
-
22
-
23
-
24
-
25
-
26
-
27
-
28
-
29
-
30
-
31
-
32
-
33
-
34
-
35
-
36
-
37
-
38
-
39
-
40
-
41
-
42
-
43
-
44
-
45
-
46
-
47
-
48
-
49
-
50
-
51
-
52
-
53
-
54
-
55
-
56
-
57
-
58
-
59
-
60
-
61
-
62
-
63
-
64
-
65
-
66
-
67
-
68
-
69
-
70
-
71
-
72
-
73
-
74
-
75
-
76
-
77
-
78
-
79
-
80
-
81
-
82
-
83
-
84
-
85
-
86
-
87
-
88
-
89
-
90
-
91
-
92
-
93
-
94
-
95
-
96
-
97
-
98
-
99
-
100
-
101
-
102
-
103
-
104
-
105
-
106
-
107
-
108
-
109
-
110
-
111
-
112
-
113
-
114
-
115
-
116
-
117
-
118
-
119
-
120
-
121
-
122
-
123
-
124
-
125
-
126
-
127
-
128
-
129
-
130
-
131
-
132
-
133
-
134
-
135
-
136
-
137
-
138
-
139
-
140
-
141
-
142
-
143
-
144
-
145
-
146
-
147
-
 148
148 -
 149
149 -
 150
150 -
 151
151 -
 152
152 -
 153
153 -
 154
154 -
 155
155 -
 156
156 -
 157
157 -
 158
158 -
 159
159 -
 160
160 -
 161
161 -
 162
162 -
 163
163 -
 164
164 -
 165
165 -
 166
166 -
 167
167 -
 168
168 -
169
-
170
-
171
-
172
-
173
-
174
-
175
-
176
-
177
-
178
-
179
-
180
-
181
-
182
-
183
-
184
-
185
-
186
-
187
-
188
-
189
-
190
-
191
-
192
-
193
-
194
-
195
-
196
-
197
-
198
-
199
-
200
-
201
-
202
-
203
-
204
-
205
-
206
-
207
-
208
-
209
-
210
-
211
-
212
-
213
-
214
-
215
-
216
-
217
-
218
-
219
-
220
-
221
-
222
-
223
-
224
-
225
-
226
-
227
-
228
-
229
-
230
-
231
-
232
-
233
-
234
-
235
-
236
-
237
-
238
-
239
-
240
-
241
-
242
-
243
-
244
 |
 |
Group nancial statements 12.9 22 23 24 25
158 Annual Report 2014
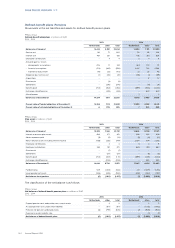
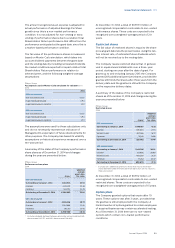
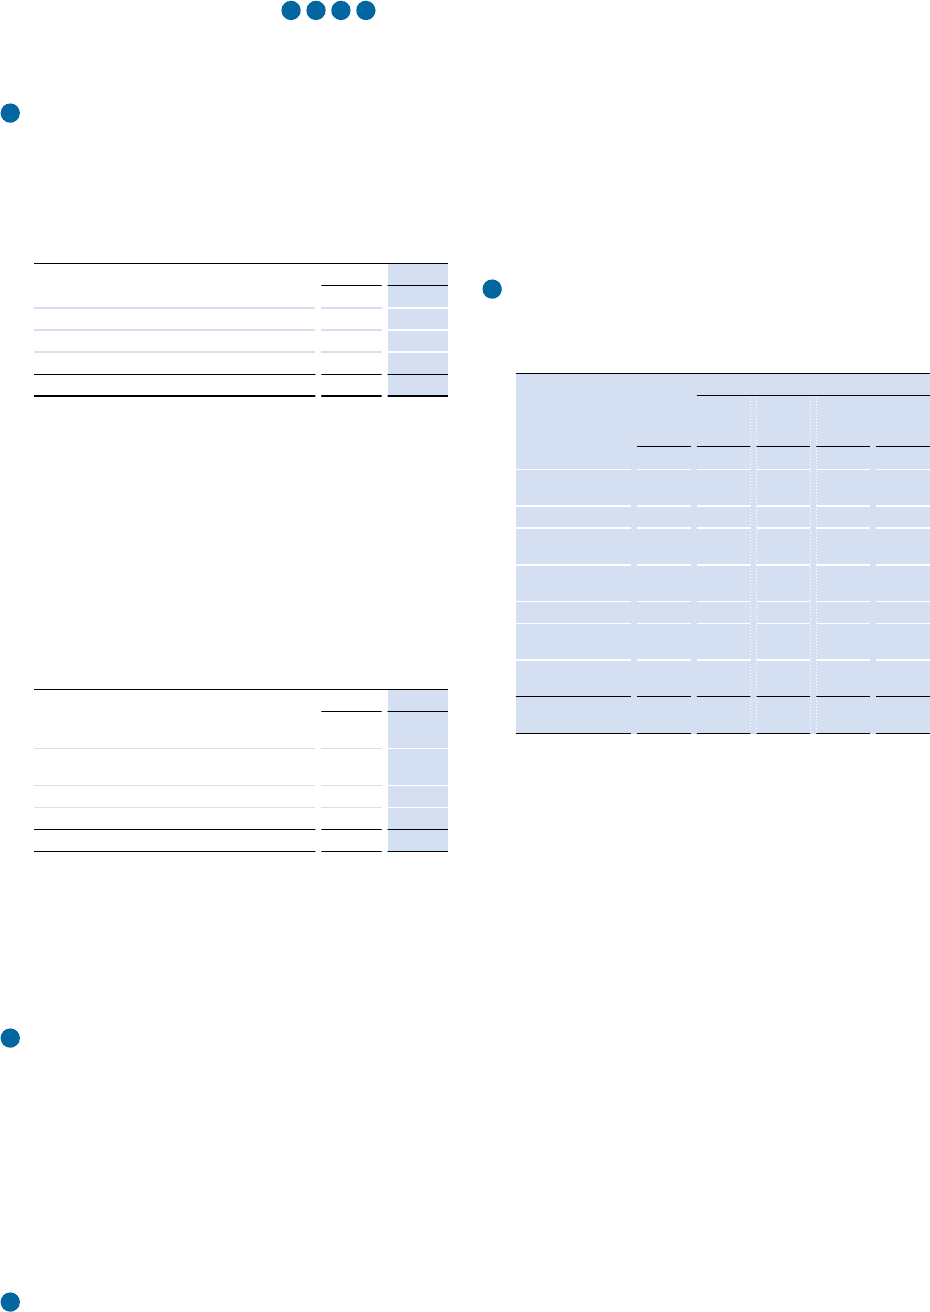
22 Other liabilities
Other non-current liabilities
Other non-current liabilities are summarized as follows:
Philips Group
Other non-current liabilities in millions of EUR
2013 - 2014
2013 2014
Accrued pension costs 813 1,061
Deferred income 214 176
Other tax liability 444 499
Other liabilities 97 102
Other non-current liabilities 1,568 1,838
The increase in the accrued pension costs is mainly
attributable to the US dened benet plan. See also
note 20, Post-employment benets.
For further details on tax related liabilities refer to
note 8, Income taxes.
Other current liabilities
Other current liabilities are summarized as follows:
Philips Group
Other current liabilities in millions of EUR
2013 - 2014
2013 2014
Accrued customer rebates that cannot be oset
with accounts receivables for those customers 530 535
Advances received from customers on orders
not covered by work in process 240 312
Other taxes including social security premiums 193 176
Other liabilities 119 368
Other current liabilities 1,082 1,391
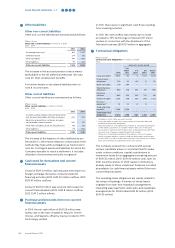
The increase of the balance of other liabilities as per
December 31, 2014 mainly relates to certain parts of the
Cathode Ray Tube antitrust litigation as mentioned in
note 26, Contingent assets and liabilities for which the
Company was able to reach a settlement. It includes
utilization of provisions previously recognized.
23 Cash used for derivatives and current
nancial assets
A total of EUR 13 million cash was paid with respect to
foreign exchange derivative contracts related to
nancing activities (2013: EUR 93 million outow; 2012:
EUR 47 million outow).
A total of EUR 6 million was received with respect to
current nancial assets (2013: EUR 8 million outow;
2012: EUR 2 million inow).
24 Purchase and proceeds from non-current
nancial assets
In 2014, the net cash inow of EUR 26 million was
mainly due to the sale of stakes in Neusoft, Chimei
Innolux, and Sapiens, oset by loans provided to TPV
Technology Limited.
In 2013, there were no signicant cash ows resulting
from investing activities.
In 2012, the cash outow was mainly due to loans
provided to TPV Technology Limited and TP Vision
venture in connection with the divestment of the
Television business (EUR 151 million in aggregate).
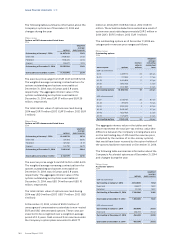
25 Contractual obligations
Philips Group
Contractual cash obligations1) in millions of EUR
2014
payments due by period
total
less
than 1
year
1-3
years
3-5
years
after 5
years
Long-term debt2) 3,665 94 6 1,030 2,535
Finance lease
obligations 232 61 80 37 54
Short-term debt 244 244 – – –
Operating lease
obligations 986 236 293 159 298
Derivative
liabilities 860 353 166 253 88
Interest on debt3) 2,617 198 387 299 1,733
Purchase
obligations4) 131 70 51 10 –
Trade and other
payables 2,499 2,499 – – –
Contractual cash
obligations 11,234 3,755 983 1,788 4,708
1) Obligations in this table are undiscounted
2) Long-term debt includes short-term portion of long-term debt and
excludes nance lease obligations
3) Approximately 15% of the debt bears interest at a oating rate. Majority
of the interest payments on variable interest rate loans in the table
above reect market forward interest rates at the period end and these
amounts may change as market interest rate changes
4) Philips has commitments related to the ordinary course of business
which in general relate to contracts and purchase order commitments
for less than 12 months. In the table, only the commitments for multiple
years are presented, including their short-term portion
The Company entered into contracts with several
venture capitalists where it committed itself to make,
under certain conditions, capital contributions to
investment funds for an aggregated remaining amount
of EUR 35 million (2013: EUR 40 million) until June 30,
2021. As at December 31, 2014 capital contributions
already made to these investment funds are recorded
as available-for-sale nancial assets within Other non-
current nancial assets.
The operating lease obligations are mainly related to
the rental of buildings. A number of these leases
originate from sale-and-leaseback arrangements.
Operating lease payments under sale-and-leaseback
arrangements for 2014 totaled EUR 42 million (2013:
EUR 42 million).