Philips 2014 Annual Report Download - page 33
Download and view the complete annual report
Please find page 33 of the 2014 Philips annual report below. You can navigate through the pages in the report by either clicking on the pages listed below, or by using the keyword search tool below to find specific information within the annual report.-
 1
1 -
2
-
3
-
4
-
5
-
6
-
7
-
8
-
9
-
10
-
11
-
12
-
13
-
14
-
15
-
16
-
17
-
18
-
19
-
20
-
21
-
22
-
 23
23 -
 24
24 -
 25
25 -
 26
26 -
 27
27 -
 28
28 -
 29
29 -
 30
30 -
 31
31 -
 32
32 -
 33
33 -
 34
34 -
 35
35 -
 36
36 -
 37
37 -
 38
38 -
 39
39 -
 40
40 -
 41
41 -
 42
42 -
 43
43 -
44
-
45
-
46
-
47
-
48
-
49
-
50
-
51
-
52
-
53
-
54
-
55
-
56
-
57
-
58
-
59
-
60
-
61
-
62
-
63
-
64
-
65
-
66
-
67
-
68
-
69
-
70
-
71
-
72
-
73
-
74
-
75
-
76
-
77
-
78
-
79
-
80
-
81
-
82
-
83
-
84
-
85
-
86
-
87
-
88
-
89
-
90
-
91
-
92
-
93
-
94
-
95
-
96
-
97
-
98
-
99
-
100
-
101
-
102
-
103
-
104
-
105
-
106
-
107
-
108
-
109
-
110
-
111
-
112
-
113
-
114
-
115
-
116
-
117
-
118
-
119
-
120
-
121
-
122
-
123
-
124
-
125
-
126
-
127
-
128
-
129
-
130
-
131
-
132
-
133
-
134
-
135
-
136
-
137
-
138
-
139
-
140
-
141
-
142
-
143
-
144
-
145
-
146
-
147
-
148
-
149
-
150
-
151
-
152
-
153
-
154
-
155
-
156
-
157
-
158
-
159
-
160
-
161
-
162
-
163
-
164
-
165
-
166
-
167
-
168
-
169
-
170
-
171
-
172
-
173
-
174
-
175
-
176
-
177
-
178
-
179
-
180
-
181
-
182
-
183
-
184
-
185
-
186
-
187
-
188
-
189
-
190
-
191
-
192
-
193
-
194
-
195
-
196
-
197
-
198
-
199
-
200
-
201
-
202
-
203
-
204
-
205
-
206
-
207
-
208
-
209
-
210
-
211
-
212
-
213
-
214
-
215
-
216
-
217
-
218
-
219
-
220
-
221
-
222
-
223
-
224
-
225
-
226
-
227
-
228
-
229
-
230
-
231
-
232
-
233
-
234
-
235
-
236
-
237
-
238
-
239
-
240
-
241
-
242
-
243
-
244
 |
 |
Group performance 5.2.2
Annual Report 2014 33
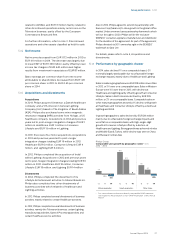
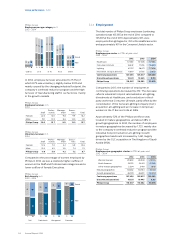
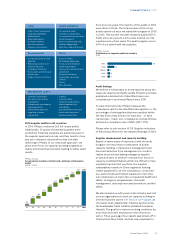
5.2.2 Employee engagement
Employee engagement is key to our competitive
performance. Engaged employees help us meet our
business goals and help make Philips a great place to
work. We have used employee engagement surveys for
over a decade to gather feedback and focus areas and
have seen tangible results along our journey.
As announced in 2012, we survey Employee
Engagement on a bi-annual basis, starting in 2013. In
2014 we implemented a brief, complementary, team-
focused survey called My Accelerate! Survey (MAS).
We have observed and shown via research the
correlation between the Employee Engagement Index
and the Net Promoter Score question “How likely is it
you would recommend Philips as a great place to work?
“ (the measurement that cumulatively covers emotional
commitment, pride and active recommendation). We
used the Net Promoter Score as a proxy for the EES
results in 2014 which was based on survey results of
some 17,000 employees. In 2015 we will perform a full
Employee Engagement Survey again.
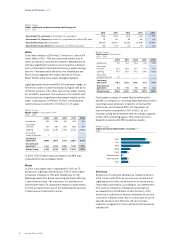
Philips Group
Employee Engagement Index in %
2010 - 2014
77
12
11
‘10
76
14
10
‘11
79
15
6
‘121)
75
16
9
‘13
72 Favorable
11 Neutral
17 Unfavorable
‘142)
1) Based on 60 pulse surveys conducted in 2012
2) Based on My Accelerate! Surveys
For more information on MAS, please refer to sub-
section 14.2.1, Engaging our employees, of this Annual
Report.
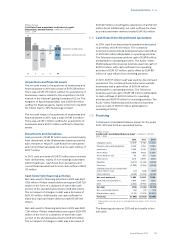
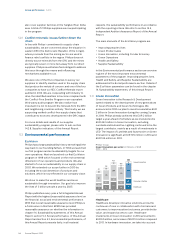
5.2.3 Diversity and inclusion
Based on the deployment of our comprehensive strategy, in
2014 Philips continued making progress on its diversity and
inclusion (D&I) agenda. We believe a diverse workforce and
an inclusive work environment are essential to a thriving
innovative business and we strive to attract employees from
a wide range of backgrounds.
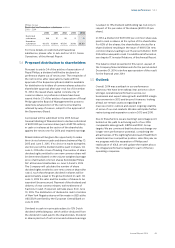
Philips Group
Gender diversity in %
2012 - 2014
57
43
‘12
58
42
‘13
58
42
‘14
Staff
71
29
‘12
71
29
‘13
71
29
‘14
Professionals
82
18
‘12
81
19
‘13
80
20
‘14
Management
86
14
‘12
85
15
‘13
82 Male
18 Female
‘14
Executives
Regarding gender diversity, we recorded an increase in
the share of female executives to 18% at year-end 2014
– up from 15% in 2013. We are well on track to achieve
the aspiration of 20% female executives by year-end
2016 – having embedded D&I objectives in HR
processes and culture-building activities, combined
with the active engagement of senior female leaders
globally.
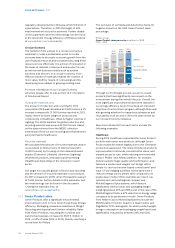
One of the key drivers of progress is the redesigned
talent management approach, which includes a
comprehensive approach to succession planning for all
executives and other key positions in order to also drive
development and career planning for individuals. In
2014, 28% of new executives internally promoted were
women, and women represented 31% of all external
executive hires. Demonstrating the Group’s
commitment to D&I, development of gender diversity
has been made a key performance indicator for Philips.
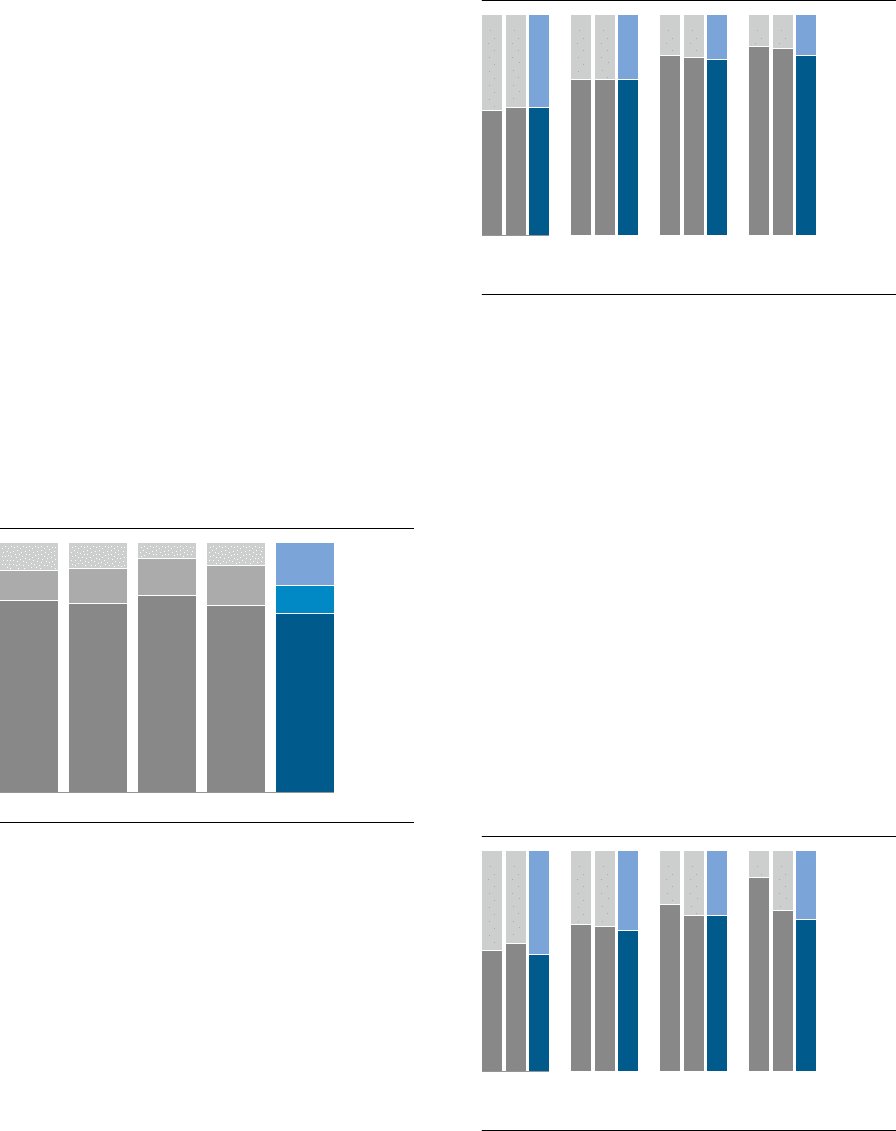
Philips Group
New hire diversity in %
2012 - 2014
55
45
‘12
58
42
‘13
53
47
‘14
Staff
67
33
‘12
66
34
‘13
64
36
‘14
Professionals
76
24
‘12
71
29
‘13
71
29
‘14
Management
88
12
‘12
73
27
‘13
69 Male
31 Female
‘14
Executives
Philips has one woman on its Executive Committee and
three female members of its Supervisory Board. Our
executives originate from more than 30 countries.
In 2014, Philips employed 35% females, the same
percentage as in 2013.