Philips 2014 Annual Report Download - page 206
Download and view the complete annual report
Please find page 206 of the 2014 Philips annual report below. You can navigate through the pages in the report by either clicking on the pages listed below, or by using the keyword search tool below to find specific information within the annual report.-
 1
1 -
2
-
3
-
4
-
5
-
6
-
7
-
8
-
9
-
10
-
11
-
12
-
13
-
14
-
15
-
16
-
17
-
18
-
19
-
20
-
21
-
22
-
23
-
24
-
25
-
26
-
27
-
28
-
29
-
30
-
31
-
32
-
33
-
34
-
35
-
36
-
37
-
38
-
39
-
40
-
41
-
42
-
43
-
44
-
45
-
46
-
47
-
48
-
49
-
50
-
51
-
52
-
53
-
54
-
55
-
56
-
57
-
58
-
59
-
60
-
61
-
62
-
63
-
64
-
65
-
66
-
67
-
68
-
69
-
70
-
71
-
72
-
73
-
74
-
75
-
76
-
77
-
78
-
79
-
80
-
81
-
82
-
83
-
84
-
85
-
86
-
87
-
88
-
89
-
90
-
91
-
92
-
93
-
94
-
95
-
96
-
97
-
98
-
99
-
100
-
101
-
102
-
103
-
104
-
105
-
106
-
107
-
108
-
109
-
110
-
111
-
112
-
113
-
114
-
115
-
116
-
117
-
118
-
119
-
120
-
121
-
122
-
123
-
124
-
125
-
126
-
127
-
128
-
129
-
130
-
131
-
132
-
133
-
134
-
135
-
136
-
137
-
138
-
139
-
140
-
141
-
142
-
143
-
144
-
145
-
146
-
147
-
148
-
149
-
150
-
151
-
152
-
153
-
154
-
155
-
156
-
157
-
158
-
159
-
160
-
161
-
162
-
163
-
164
-
165
-
166
-
167
-
168
-
169
-
170
-
171
-
172
-
173
-
174
-
175
-
176
-
177
-
178
-
179
-
180
-
181
-
182
-
183
-
184
-
185
-
186
-
187
-
188
-
189
-
190
-
191
-
192
-
193
-
194
-
195
-
 196
196 -
 197
197 -
 198
198 -
 199
199 -
 200
200 -
 201
201 -
 202
202 -
 203
203 -
 204
204 -
 205
205 -
 206
206 -
 207
207 -
 208
208 -
 209
209 -
 210
210 -
 211
211 -
 212
212 -
 213
213 -
 214
214 -
 215
215 -
 216
216 -
217
-
218
-
219
-
220
-
221
-
222
-
223
-
224
-
225
-
226
-
227
-
228
-
229
-
230
-
231
-
232
-
233
-
234
-
235
-
236
-
237
-
238
-
239
-
240
-
241
-
242
-
243
-
244
 |
 |

Sustainability statements 14.2.8
206 Annual Report 2014
Tin mining in Indonesia
Indonesia produces roughly one-third of the world’s tin
supply, of which the vast majority comes from the islands
Bangka and Belitung. Philips is alerted by reports about
environmental and social issues associated with this tin
production. It is reported that the intensity of tin mining, the
illegal small-scale miners and the irresponsible way it is
carried out cause environmental devastation and safety risks
for miners.
Philips does not directly source tin from Indonesia and there
are typically 7 or more tiers in the supply chain between a
mine and a Philips supplier. Nevertheless, in 2013 we decided
to investigate how we can support the move towards more
sustainable mining practices in Indonesia.
We teamed up with other frontrunner companies, the tin
industry and civil society in the Indonesian Tin Working Group
(TWG), coordinated by the Dutch Sustainable Trade Initiative.
The group’s goal is to positively contribute to addressing the
sustainability challenges of tin mining and smelting in Bangka
and Belitung while recognizing the economic benefits of the
sector in terms of development and poverty reduction.
In 2014 the TWG entered the next phase which was co-
funded by IDH, Philips and other TWG members. By
working with local stakeholders we aim to support
Indonesian Government, businesses and civil society
eorts, to better formalize Indonesian tin production,
make it economically benecial for local communities, and
to reduce negative social and environmental impacts.
“ Philips was one of the first companies to step up
and show their commitment to supply chain
responsibility by working on improving conditions
at the deepest level of the supply chain, mineral
sourcing. They have taken a proactive leadership
role in forming and supporting the IDH Indonesian
Tin Working Group in cooperation with
Milieudefensie / Friends of the Earth.”
Evert Hassink
Friends of the Earth Netherlands
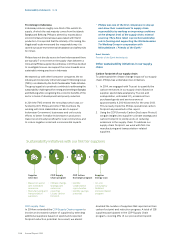
Other sustainability initiatives in our supply
chain
Carbon footprint of our supply chain
To understand the climate change impact of our supply
chain, Philips has undertaken two initiatives:
1. In 2014, we engaged with Trucost to quantify the
carbon emissions in our supply chain. Based on
supplier spend data analysis by Trucost and
extrapolation, estimated CO2 emissions from
purchased goods and services were at
approximately 4,200 kilotonnes for the year 2013.
This is nearly triple the Philips operational carbon
footprint as presented in this report.
2. Using the CDP (formerly Carbon Disclosure Project)
we gain insights into supplier’s climate strategy and
carbon footprint to jointly work on reducing
emissions in the supply chain. To address our
supply chain footprint, we work with rst-tier
manufacturing and transportation-related
suppliers.
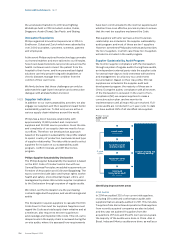
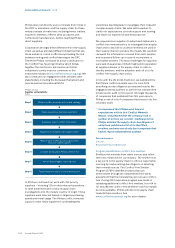
Supplier
selection
•Based on spend
and estimated
emissions
•Manufacturing and
transportation
suppliers
CDP Supply
Chain program
•Climate change
strategy and
emissions
reporting
•Locate carbon
hotspots
CDP Action
Exchange program
•Identify
collaboration
opportunities
•Identify savings
potential
Supplier
energy scan
•On-site
consultancy
•Detailed
implementation
program
Sustainability initiatives with our first tier suppliers
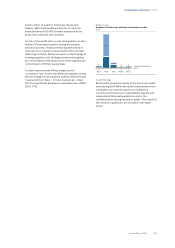
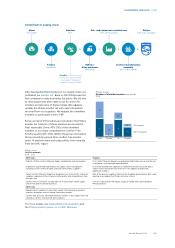
CDP supply chain
In 2014 we extended the CDP Supply Chain program to
involve an increased number of suppliers by selecting
additional suppliers based on spend and expected
footprint reduction potential. As a result, we almost
doubled the number of suppliers that reported on their
carbon footprint and reduction progress. A total of 128
suppliers participated in the CDP Supply Chain
program, covering 25% of our procurement spend.