Philips 2014 Annual Report Download - page 53
Download and view the complete annual report
Please find page 53 of the 2014 Philips annual report below. You can navigate through the pages in the report by either clicking on the pages listed below, or by using the keyword search tool below to find specific information within the annual report.-
 1
1 -
2
-
3
-
4
-
5
-
6
-
7
-
8
-
9
-
10
-
11
-
12
-
13
-
14
-
15
-
16
-
17
-
18
-
19
-
20
-
21
-
22
-
23
-
24
-
25
-
26
-
27
-
28
-
29
-
30
-
31
-
32
-
33
-
34
-
35
-
36
-
37
-
38
-
39
-
40
-
41
-
42
-
 43
43 -
 44
44 -
 45
45 -
 46
46 -
 47
47 -
 48
48 -
 49
49 -
 50
50 -
 51
51 -
 52
52 -
 53
53 -
 54
54 -
 55
55 -
 56
56 -
 57
57 -
 58
58 -
 59
59 -
 60
60 -
 61
61 -
 62
62 -
 63
63 -
64
-
65
-
66
-
67
-
68
-
69
-
70
-
71
-
72
-
73
-
74
-
75
-
76
-
77
-
78
-
79
-
80
-
81
-
82
-
83
-
84
-
85
-
86
-
87
-
88
-
89
-
90
-
91
-
92
-
93
-
94
-
95
-
96
-
97
-
98
-
99
-
100
-
101
-
102
-
103
-
104
-
105
-
106
-
107
-
108
-
109
-
110
-
111
-
112
-
113
-
114
-
115
-
116
-
117
-
118
-
119
-
120
-
121
-
122
-
123
-
124
-
125
-
126
-
127
-
128
-
129
-
130
-
131
-
132
-
133
-
134
-
135
-
136
-
137
-
138
-
139
-
140
-
141
-
142
-
143
-
144
-
145
-
146
-
147
-
148
-
149
-
150
-
151
-
152
-
153
-
154
-
155
-
156
-
157
-
158
-
159
-
160
-
161
-
162
-
163
-
164
-
165
-
166
-
167
-
168
-
169
-
170
-
171
-
172
-
173
-
174
-
175
-
176
-
177
-
178
-
179
-
180
-
181
-
182
-
183
-
184
-
185
-
186
-
187
-
188
-
189
-
190
-
191
-
192
-
193
-
194
-
195
-
196
-
197
-
198
-
199
-
200
-
201
-
202
-
203
-
204
-
205
-
206
-
207
-
208
-
209
-
210
-
211
-
212
-
213
-
214
-
215
-
216
-
217
-
218
-
219
-
220
-
221
-
222
-
223
-
224
-
225
-
226
-
227
-
228
-
229
-
230
-
231
-
232
-
233
-
234
-
235
-
236
-
237
-
238
-
239
-
240
-
241
-
242
-
243
-
244
 |
 |

Sector performance 6.2.3
Annual Report 2014 53
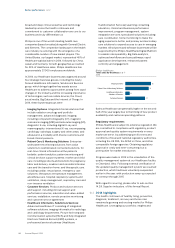
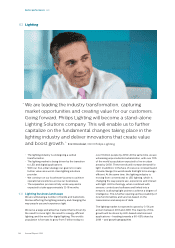
6.2.3 2014 highlights
• Empowering consumers to take control of their own
health with digital solutions for healthy living and
disease prevention, Philips launched its latest
connected devices and apps at IFA in Berlin.
Highlights included a smart air purier, an app to
manage treatment of chronic pain and an oral
healthcare app to help kids brush their teeth more
eectively.
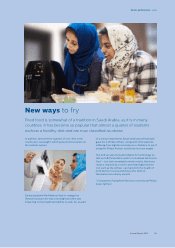
• Continuing the geographical expansion of Philips
product innovations, the Philips Airfryer is now
available in more than 100 countries. Philips is a
leader in the world’s low-fat fryer market.
• The success of established propositions like the
Philips Sonicare DiamondClean and the Philips
Sonicare AirFloss, along with new introductions like
Philips Sonicare for Kids, drove continued growth
across the world, in particular in China, Japan,
Germany and North America.
• Delivering on its male grooming growth strategy to
drive loyalty and create more value among existing
users, Philips launched the Philips Shaver Series
9000, our most advanced shaver yet, in 47 countries
around the world.
• Award-winning designs and advanced technology
further strengthened Philips’ leadership position in
the Chinese air purication market, with consumers
responding to innovations such as the Vitashield
Intelligent Purication System, which removes indoor
contaminants that can impact health and well-being.
• Professional endorsement and channel expansion
are core to the growth momentum of Philips’ Mother
and Childcare business (Avent). In Germany,
distribution was further extended in the drugstore
channel, with professional endorsement a key trigger
for consumers. In China, distribution was expanded
to more cities, with a continued focus to make Philips
Avent the brand that is most recommended by
mothers.
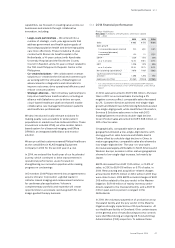
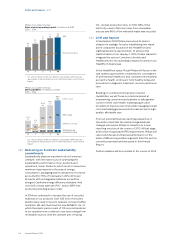
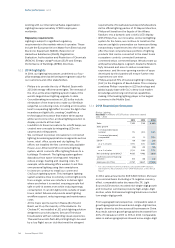
6.2.4 2014 nancial performance
Philips Consumer Lifestyle
Key data in millions of EUR unless otherwise stated
2012 - 2014
2012 2013 2014
Sales 4,319 4,605 4,731
Sales growth
% increase (decrease), nominal 15% 7% 3%
% increase (decrease),
comparable1) 9% 10% 6%
EBITA 1) 456 483 573
as a % of sales 10.6% 10.5% 12.1%
EBIT 400 429 520
as a % of sales 9.3% 9.3% 11.0%
Net operating capital (NOC)1) 1,205 1,261 1,353
Cash ows before nancing
activities1) 413 480 553
Employees (in FTEs) 16,542 17,255 16,639
1) For a reconciliation to the most directly comparable GAAP measures,
see chapter 15, Reconciliation of non-GAAP information, of this Annual
Report
Sales amounted to EUR 4,731 million, a nominal
increase of 3% compared to 2013. Excluding a 3%
negative currency impact, comparable sales were 6%
higher year-on-year. Health & Wellness achieved
double-digit-growth and Domestic Appliances
recorded high-single-digit growth, while Personal Care
recorded low-single-digit growth. Green Product sales
amounted to EUR 2,605 million, or 55% of total sector
sales.
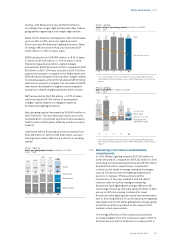
From a geographical perspective, comparable sales
showed an 8% increase in growth geographies and 3%
growth in mature geographies. In growth geographies,
increase was mainly driven by China and Middle East &
Turkey, primarily in the Health & Wellness and Domestic
Appliances businesses. Growth geographies’ share of
sector sales was in line with 2013 at 47%.
EBITA increased from EUR 483 million, or 10.5% of sales,
in 2013 to EUR 573 million, or 12.1% of sales, in 2014.
Restructuring and acquisition-related charges
amounted to EUR 9 million in 2014, compared to EUR
14 million in 2013. EBITA in 2013 also included a EUR 1
million past-service pension cost gain in the US. The
year-on-year EBITA increase was driven by improved
earnings in all businesses and more than oset currency
headwinds.
EBIT amounted to EUR 520 million, or 11.0% of sales,
which included EUR 53 million of amortization charges,
mainly related to intangible assets at Health & Wellness
and Domestic Appliances.
Net operating capital increased from EUR 1,261 million
in 2013 to EUR 1,353 million in 2014, due to higher
working capital and a reduction in provisions.
Cash ows before nancing activities increased from
EUR 480 million in 2013 to EUR 553 million in 2014,
mainly attributable to higher earnings.
Philips Consumer Lifestyle
Sales per geographic cluster in millions of EUR
2010 - 2014
1,273
560
193
1,290
3,316
‘10
1,323
688
228
1,532
3,771
‘11
1,325
768
272
1,954
4,319
‘12
1,350
769
299
2,187
4,605
‘13
1,403 Western Europe
781 North America
324 Other mature
2,223 Growth
4,731
‘14