Philips 2014 Annual Report Download - page 132
Download and view the complete annual report
Please find page 132 of the 2014 Philips annual report below. You can navigate through the pages in the report by either clicking on the pages listed below, or by using the keyword search tool below to find specific information within the annual report.-
 1
1 -
2
-
3
-
4
-
5
-
6
-
7
-
8
-
9
-
10
-
11
-
12
-
13
-
14
-
15
-
16
-
17
-
18
-
19
-
20
-
21
-
22
-
23
-
24
-
25
-
26
-
27
-
28
-
29
-
30
-
31
-
32
-
33
-
34
-
35
-
36
-
37
-
38
-
39
-
40
-
41
-
42
-
43
-
44
-
45
-
46
-
47
-
48
-
49
-
50
-
51
-
52
-
53
-
54
-
55
-
56
-
57
-
58
-
59
-
60
-
61
-
62
-
63
-
64
-
65
-
66
-
67
-
68
-
69
-
70
-
71
-
72
-
73
-
74
-
75
-
76
-
77
-
78
-
79
-
80
-
81
-
82
-
83
-
84
-
85
-
86
-
87
-
88
-
89
-
90
-
91
-
92
-
93
-
94
-
95
-
96
-
97
-
98
-
99
-
100
-
101
-
102
-
103
-
104
-
105
-
106
-
107
-
108
-
109
-
110
-
111
-
112
-
113
-
114
-
115
-
116
-
117
-
118
-
119
-
120
-
121
-
 122
122 -
 123
123 -
 124
124 -
 125
125 -
 126
126 -
 127
127 -
 128
128 -
 129
129 -
 130
130 -
 131
131 -
 132
132 -
 133
133 -
 134
134 -
 135
135 -
 136
136 -
 137
137 -
 138
138 -
 139
139 -
 140
140 -
 141
141 -
 142
142 -
143
-
144
-
145
-
146
-
147
-
148
-
149
-
150
-
151
-
152
-
153
-
154
-
155
-
156
-
157
-
158
-
159
-
160
-
161
-
162
-
163
-
164
-
165
-
166
-
167
-
168
-
169
-
170
-
171
-
172
-
173
-
174
-
175
-
176
-
177
-
178
-
179
-
180
-
181
-
182
-
183
-
184
-
185
-
186
-
187
-
188
-
189
-
190
-
191
-
192
-
193
-
194
-
195
-
196
-
197
-
198
-
199
-
200
-
201
-
202
-
203
-
204
-
205
-
206
-
207
-
208
-
209
-
210
-
211
-
212
-
213
-
214
-
215
-
216
-
217
-
218
-
219
-
220
-
221
-
222
-
223
-
224
-
225
-
226
-
227
-
228
-
229
-
230
-
231
-
232
-
233
-
234
-
235
-
236
-
237
-
238
-
239
-
240
-
241
-
242
-
243
-
244
 |
 |

Group nancial statements 12.9 6
132 Annual Report 2014
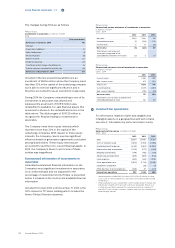
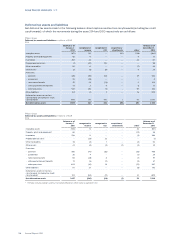
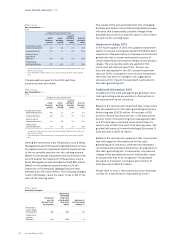
The changes during 2014 are as follows:
Philips Group
Investments in associates in millions of EUR
2014
Total investments
Balance as of January 1, 2014 161
Changes:
Acquisitions/additions 10
Sales/Redemption (1)
Reclassications (8)
Share in income 30
Dividends declared (41)
Translation and exchange rate dierences 16
Transfer to assets classied as held for sale (10)
Balance as of December 31, 2014 157
Included in the line acquisitions/additions is an
investment of EUR 6 million where the Company owns
less than 20% in the capital of the underlying company
but is able to exercise signicant inuence and is
therefore accounted for as an Investment in associate.
During 2014 the Company’s shareholding in one of its
investments in associates was diluted and
subsequently an amount of EUR 8 million was
reclassied to available-for-sale nancial assets, this
movement is shown in the reclassications line in the
table above. The dilution gain of EUR 32 million is
recognized in Results relating to investments in
associates.
The Company owns three equity interests which
represent more than 20% in the capital of the
underlying companies. With respect to these equity
interests, the Company cannot exercise signicant
inuence based on governance agreements concluded
among shareholders. These equity interests are
accounted for as Other non-current nancial assets. In
2014, the Company’s share in net income of these
entities was insignicant.
Summarized information of investments in
associates
Unaudited summarized nancial information on the
Company’s most signicant investments in associates,
on a combined basis and not adjusted for the
percentage of ownership held by Philips, is presented
below. It is based on the most recent available nancial
information.
Included from April 2012 until December 31, 2013 is the
30%-interest in TP Vision Holding which includes the
former Philips Television business.
Philips Group
Summarized income statement of investments in associates
in millions of EUR
2012 - 2014
2012 2013 2014
Net sales 2,534 2,180 341
Income before taxes (7) (243) 126
Income taxes 2 12 (37)
Net income (5) (231) 89
Total share in net income of
associates recognized in the
Consolidated statements of income (5) 5 30
Philips Group
Summarized net asset value of investments in associates
in millions of EUR
2013 - 2014
2013 2014
Current assets 1,368 584
Non-current assets 412 190
Total assets 1,780 774
Current liabilities (1,327) (360)
Non-current liabilities (278) (45)
Net asset value 175 369
Investments in associates included in the
Consolidated balance sheet 161 157
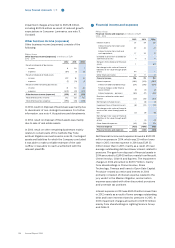
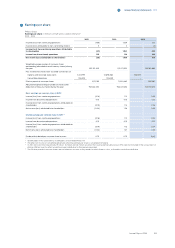
6Income from operations
For information related to Sales and tangible and
intangible assets on a geographical and sector basis,
see note 2, Information by sector and main country.
Philips Group
Sales and costs by nature in millions of EUR
2012 - 2014
2012 2013 2014
Sales 22,234 21,990 21,391
Costs of materials used (7,852) (7,494) (7,296)
Employee benet expenses (6,361) (5,814) (6,080)
Depreciation and amortization (1,242) (1,177) (1,187)
Shipping and handling (749) (762) (741)
Advertising and promotion (829) (869) (913)
Lease expense (360) (344) (318)1)
Other operational costs (3,923) (3,734) (4,156)2)
Impairment of goodwill – (28) (3)
Other business income (expenses) (326) 87 (211)
Income from operations 592 1,855 486
1) Lease expense includes EUR 35 million (2013: EUR 42 million) of other
costs, such as fuel and electricity, and taxes to be paid and reimbursed
to the lessor
2) Other operational costs contain items which are dissimilar in nature and
individually insignicant in amount to disclose separately. These costs
contain among others expenses for outsourcing services, mainly in IT
and HR, 3rd party workers, warranty, patents and costs for travelling and
external legal services.