Philips 2014 Annual Report Download - page 165
Download and view the complete annual report
Please find page 165 of the 2014 Philips annual report below. You can navigate through the pages in the report by either clicking on the pages listed below, or by using the keyword search tool below to find specific information within the annual report.-
 1
1 -
2
-
3
-
4
-
5
-
6
-
7
-
8
-
9
-
10
-
11
-
12
-
13
-
14
-
15
-
16
-
17
-
18
-
19
-
20
-
21
-
22
-
23
-
24
-
25
-
26
-
27
-
28
-
29
-
30
-
31
-
32
-
33
-
34
-
35
-
36
-
37
-
38
-
39
-
40
-
41
-
42
-
43
-
44
-
45
-
46
-
47
-
48
-
49
-
50
-
51
-
52
-
53
-
54
-
55
-
56
-
57
-
58
-
59
-
60
-
61
-
62
-
63
-
64
-
65
-
66
-
67
-
68
-
69
-
70
-
71
-
72
-
73
-
74
-
75
-
76
-
77
-
78
-
79
-
80
-
81
-
82
-
83
-
84
-
85
-
86
-
87
-
88
-
89
-
90
-
91
-
92
-
93
-
94
-
95
-
96
-
97
-
98
-
99
-
100
-
101
-
102
-
103
-
104
-
105
-
106
-
107
-
108
-
109
-
110
-
111
-
112
-
113
-
114
-
115
-
116
-
117
-
118
-
119
-
120
-
121
-
122
-
123
-
124
-
125
-
126
-
127
-
128
-
129
-
130
-
131
-
132
-
133
-
134
-
135
-
136
-
137
-
138
-
139
-
140
-
141
-
142
-
143
-
144
-
145
-
146
-
147
-
148
-
149
-
150
-
151
-
152
-
153
-
154
-
 155
155 -
 156
156 -
 157
157 -
 158
158 -
 159
159 -
 160
160 -
 161
161 -
 162
162 -
 163
163 -
 164
164 -
 165
165 -
 166
166 -
 167
167 -
 168
168 -
 169
169 -
 170
170 -
 171
171 -
 172
172 -
 173
173 -
 174
174 -
 175
175 -
176
-
177
-
178
-
179
-
180
-
181
-
182
-
183
-
184
-
185
-
186
-
187
-
188
-
189
-
190
-
191
-
192
-
193
-
194
-
195
-
196
-
197
-
198
-
199
-
200
-
201
-
202
-
203
-
204
-
205
-
206
-
207
-
208
-
209
-
210
-
211
-
212
-
213
-
214
-
215
-
216
-
217
-
218
-
219
-
220
-
221
-
222
-
223
-
224
-
225
-
226
-
227
-
228
-
229
-
230
-
231
-
232
-
233
-
234
-
235
-
236
-
237
-
238
-
239
-
240
-
241
-
242
-
243
-
244
 |
 |

29 Group nancial statements 12.9
Annual Report 2014 165
The exercise prices of the Accelerate! options are EUR
15.24 and EUR 22.43 for EUR-denominated options and
is USD 20.02 for USD-denominated options. The
weighted average remaining contractual term for EUR-
denominated Accelerate! options outstanding and
exercisable at December 31, 2014 is 7.2 and 7.1 years,
respectively. The weighted average remaining
contractual term for USD-Accelerate! options
outstanding and exercisable at December 31, 2014 is 7.1
years. The aggregate intrinsic value of the EUR-
denominated Accelerate! options outstanding and
exercisable at December 31, 2014, was EUR 15 million
and EUR 14 million, respectively. The aggregate intrinsic
value of the USD-denominated Accelerate! options
outstanding and exercisable at December 31, 2014, was
USD 4 million and USD 4 million, respectively.
Cash received from exercises for EUR-denominated
and USD-denominated Accelerate! options amounted
to EUR 21 million in 2014. The actual tax deductions
realized as a result of Accelerate! options exercises
totaled approximately EUR 1 million in 2014.
The total intrinsic value of Accelerate! options exercised
during 2014 was EUR 10 million for EUR-denominated
options and USD 5 million for USD-denominated
options.
Other plans
Employee share purchase plan
Under the terms of employee stock purchase plans
established by the Company in various countries,
substantially all employees in those countries are
eligible to purchase a limited number of Philips shares
at discounted prices through payroll withholdings, of
which the maximum ranges from 10% to 20% of total
salary. Generally, the discount provided to the
employees is in the range of 10% to 20%. A total of
1,326,548 shares were bought by employees in 2014
under the plan at an average price of EUR 24.94 (2013:
1,425,048 shares at EUR 21.92; 2012: 1,906,183 shares at
EUR 15.69).
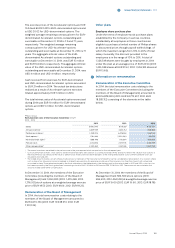
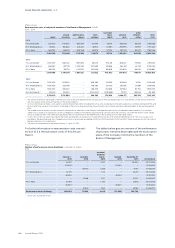
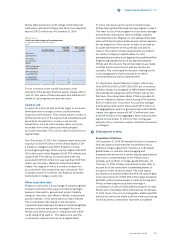
29 Information on remuneration
Remuneration of the Executive Committee
In 2014, the total remuneration costs relating to the
members of the Executive Committee (including the
members of the Board of Management) amounted to
EUR 16,878,909 (2013: EUR 24,773,537, 2012: EUR
18,585,112) consisting of the elements in the table
below.
Philips Group
Remuneration costs of the Executive Committee in EUR
2012 - 2014
2012 2013 2014
Salary 5,640,090 6,011,557 6,513,027
Annual incentive1) 4,839,949 4,422,732 1,526,658
Performance shares2) 1,049,205 6,478,554 3,357,142
Stock options2) 1,194,444 2,020,040 583,755
Restricted share rights2) 1,566,448 1,115,504 409,809
Pension costs 2,054,516 2,277,705 2,458,759
Other compensation3) 2,240,460 2,447,445 2,029,759
1) The annual incentives are related to the performance in the year reported which are paid out in the subsequent year
2) Costs of performance shares, stock options and restricted share rights are based on accounting standards (IFRS) and do not reect the value of stock options at
the end of the lock up period and the value of performance shares and restricted share rights at the vesting/release date. Costs for the Accelerate! Grant are
included in 2012 and 2013
3) The stated amounts mainly concern (share of) allowances to members of the Executive Committee that can be considered as remuneration. In a situation where
such a share of an allowance can be considered as (indirect) remuneration (for example, private use of the company car), then the share is both valued and
accounted for here. The method employed by the scal authorities in the Netherlands is the starting point for the value stated. In 2012 and 2013 a crisis levy tax
has been imposed by the Dutch government, amounting in total to EUR 1,245,944 for 2013 and to EUR 702,940 for 2012. These amounts are included in the
amounts stated under Other compensation.
At December 31, 2014, the members of the Executive
Committee (including the members of the Board of
Management) held 1,050,080 (2013: 1,479,498, 2012:
1,376,913) stock options at a weighted average exercise
price of EUR 18.53 (2013: EUR 18.69, 2012: EUR 18.23).
Remuneration of the Board of Management
In 2014, the total remuneration costs relating to the
members of the Board of Management amounted to
EUR 6,635,334 (2013: EUR 10,928,951, 2012: EUR
7,301,335).
At December 31, 2014, the members of the Board of
Management held 586,500 stock options (2013:
586,500; 2012: 454,500) at a weighted average exercise
price of EUR 19.60 (2013: EUR 19.60; 2012: EUR 18.78).