Philips 2014 Annual Report Download - page 195
Download and view the complete annual report
Please find page 195 of the 2014 Philips annual report below. You can navigate through the pages in the report by either clicking on the pages listed below, or by using the keyword search tool below to find specific information within the annual report.-
 1
1 -
2
-
3
-
4
-
5
-
6
-
7
-
8
-
9
-
10
-
11
-
12
-
13
-
14
-
15
-
16
-
17
-
18
-
19
-
20
-
21
-
22
-
23
-
24
-
25
-
26
-
27
-
28
-
29
-
30
-
31
-
32
-
33
-
34
-
35
-
36
-
37
-
38
-
39
-
40
-
41
-
42
-
43
-
44
-
45
-
46
-
47
-
48
-
49
-
50
-
51
-
52
-
53
-
54
-
55
-
56
-
57
-
58
-
59
-
60
-
61
-
62
-
63
-
64
-
65
-
66
-
67
-
68
-
69
-
70
-
71
-
72
-
73
-
74
-
75
-
76
-
77
-
78
-
79
-
80
-
81
-
82
-
83
-
84
-
85
-
86
-
87
-
88
-
89
-
90
-
91
-
92
-
93
-
94
-
95
-
96
-
97
-
98
-
99
-
100
-
101
-
102
-
103
-
104
-
105
-
106
-
107
-
108
-
109
-
110
-
111
-
112
-
113
-
114
-
115
-
116
-
117
-
118
-
119
-
120
-
121
-
122
-
123
-
124
-
125
-
126
-
127
-
128
-
129
-
130
-
131
-
132
-
133
-
134
-
135
-
136
-
137
-
138
-
139
-
140
-
141
-
142
-
143
-
144
-
145
-
146
-
147
-
148
-
149
-
150
-
151
-
152
-
153
-
154
-
155
-
156
-
157
-
158
-
159
-
160
-
161
-
162
-
163
-
164
-
165
-
166
-
167
-
168
-
169
-
170
-
171
-
172
-
173
-
174
-
175
-
176
-
177
-
178
-
179
-
180
-
181
-
182
-
183
-
184
-
 185
185 -
 186
186 -
 187
187 -
 188
188 -
 189
189 -
 190
190 -
 191
191 -
 192
192 -
 193
193 -
 194
194 -
 195
195 -
 196
196 -
 197
197 -
 198
198 -
 199
199 -
 200
200 -
 201
201 -
 202
202 -
 203
203 -
 204
204 -
 205
205 -
206
-
207
-
208
-
209
-
210
-
211
-
212
-
213
-
214
-
215
-
216
-
217
-
218
-
219
-
220
-
221
-
222
-
223
-
224
-
225
-
226
-
227
-
228
-
229
-
230
-
231
-
232
-
233
-
234
-
235
-
236
-
237
-
238
-
239
-
240
-
241
-
242
-
243
-
244
 |
 |

Sustainability statements 14.2.4
Annual Report 2014 195
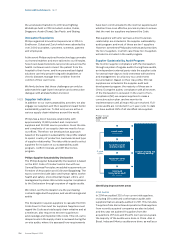
The new governance structure launched in the
Consumer Lifestyle organization in 2013, to embed
Health and Safety performance reviews and ownership
in the businesses, proved successful.
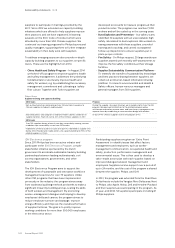
14.2.5 General Business Principles
In 2014 393 GBP complaints were led via the Philips
Ethics Line and the GBP Compliance Ocers.
Compared with 2013 (335 complaints), this represents
an increase of 17%.
This upward trend in the overall number of concerns
can be attributed primarily to signicantly more
concerns being reported in Latin America (more
specically in Brazil), which now account for 30% of the
total number of reports (2013: 17%). Europe and the
Middle East (18% of the total) also showed an upward
trend in terms of absolute numbers. In EMEA there were
44% more complaints than in 2013. This overall increase
is believed to be due to the intensive communication
campaigns to increase awareness of employees’ rights
with regard to the GBP, as well as to the reporting
facilities that are available to them. The number of
complaints in the Asia Pacic region (17% of the total)
decreased compared with 2013, making the current
percentage more comparable with that in 2012 (18%). In
North America the absolute number of complaints
declined somewhat, accounting for 35% of the total
number in 2014 (2013: 43%). We believe the continued
dominance of North America and, since the beginning
of 2014, Latin America as well, is due to the employees’
very high level of awareness of compliance issues and
their ability to assert their rights in this respect.
The most common types of concerns are listed below.
Treatment of employees
As in other years, the most commonly reported concern
related to the Treatment of employees, and accounted
for 52% of the total. The vast majority of these
complaints can be classied as either ‘Equal and fair
treatment’ or ‘Respectful treatment’, and together they
accounted for 81% of employee-related concerns.
Concerns that fall under ‘Equal and fair treatment’
related primarily to favoritism, discrimination and unfair
treatment. More than 33% of these reports originated in
the United States, with a further 20% being reported in
Brazil. Looking at the ‘Respectful treatment’ category,
which concerns primarily reports of verbal abuse,
(sexual) harassment and a hostile work environment,
again about one third of the complaints originated in
the US, with another third coming from Brazil. Some
58% of all complaints led in Brazil related to these two
topics. For the US, this was 50%.
Business integrity
The second most-reported topic, which accounted for
28% of all reported cases, was Business integrity (2013:
33%). The majority (40%) of these concerns originated
in the Asia Pacic region, followed by Europe and the
Middle East (34%), Latin America (15%) and North
America (11%).
More information on these categories can be found in
the GBP Directives on www.philips.com/gbp.
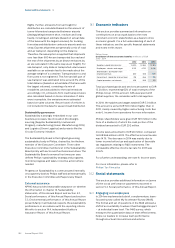
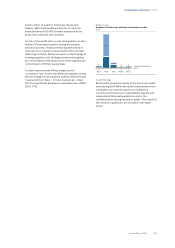
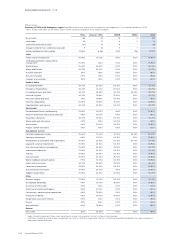
Philips Group
Breakdown of reported GBP concerns in number of reports
2010 - 2014
2010 2011 2012 2013 2014
Health & Safety 3 2 11 3 10
Treatment of
employees 184 132 205 203 203
- Collective
bargaining 1 – 1 5 –
- Equal and fair
treatment 64 41 72 80 72
- Employee
development 1 – – 4 –
- Employee privacy 2 1 1 1 3
- Employee relations 4 1 2 5 6
- Respectful
treatment 96 71 102 84 93
- Remuneration 12 6 15 15 11
- Right to organize – – 1 – –
- Working hours 4 2 – 3 5
- HR other – 10 11 6 13
Legal 13 10 19 9 30
Business Integrity 112 107 119 109 110
Supply management 4 3 3 5 6
IT – – – 6 7
Other 22 15 17 – 27
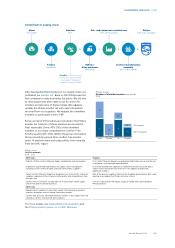
Total 338 269 374 335 393
Substantiated/unsubstantiated concerns
Out of the 393 concerns reported in 2014, 133 are still
pending closure, especially those that were led
towards the end of the year. The table below shows a
comparison between those complaints which, after
investigation, could be substantiated and those that
could not.
Out of the 260 complaints investigated, 27% were
substantiated after investigation. This is approximately
the same level as in 2013 (28%) and 2012 (26%). Also,
looking at the various types of issue, there were no
striking dierences in the percentage of substantiated
complaints compared to 2013. The biggest dierence is
the number of substantiated Business integrity
complaints, which now stands at 36% compared to 50%
in 2013.
Substantiated complaints, i.e. complaints in which a
breach of our General Business Principles was
detected, were followed up with a range of disciplinary
and corrective measures. The action taken varied from
termination of employment, written warnings and
suspension, to training aimed at raising awareness of
organizational measures.