Philips 2014 Annual Report Download - page 230
Download and view the complete annual report
Please find page 230 of the 2014 Philips annual report below. You can navigate through the pages in the report by either clicking on the pages listed below, or by using the keyword search tool below to find specific information within the annual report.-
 1
1 -
2
-
3
-
4
-
5
-
6
-
7
-
8
-
9
-
10
-
11
-
12
-
13
-
14
-
15
-
16
-
17
-
18
-
19
-
20
-
21
-
22
-
23
-
24
-
25
-
26
-
27
-
28
-
29
-
30
-
31
-
32
-
33
-
34
-
35
-
36
-
37
-
38
-
39
-
40
-
41
-
42
-
43
-
44
-
45
-
46
-
47
-
48
-
49
-
50
-
51
-
52
-
53
-
54
-
55
-
56
-
57
-
58
-
59
-
60
-
61
-
62
-
63
-
64
-
65
-
66
-
67
-
68
-
69
-
70
-
71
-
72
-
73
-
74
-
75
-
76
-
77
-
78
-
79
-
80
-
81
-
82
-
83
-
84
-
85
-
86
-
87
-
88
-
89
-
90
-
91
-
92
-
93
-
94
-
95
-
96
-
97
-
98
-
99
-
100
-
101
-
102
-
103
-
104
-
105
-
106
-
107
-
108
-
109
-
110
-
111
-
112
-
113
-
114
-
115
-
116
-
117
-
118
-
119
-
120
-
121
-
122
-
123
-
124
-
125
-
126
-
127
-
128
-
129
-
130
-
131
-
132
-
133
-
134
-
135
-
136
-
137
-
138
-
139
-
140
-
141
-
142
-
143
-
144
-
145
-
146
-
147
-
148
-
149
-
150
-
151
-
152
-
153
-
154
-
155
-
156
-
157
-
158
-
159
-
160
-
161
-
162
-
163
-
164
-
165
-
166
-
167
-
168
-
169
-
170
-
171
-
172
-
173
-
174
-
175
-
176
-
177
-
178
-
179
-
180
-
181
-
182
-
183
-
184
-
185
-
186
-
187
-
188
-
189
-
190
-
191
-
192
-
193
-
194
-
195
-
196
-
197
-
198
-
199
-
200
-
201
-
202
-
203
-
204
-
205
-
206
-
207
-
208
-
209
-
210
-
211
-
212
-
213
-
214
-
215
-
216
-
217
-
218
-
219
-
 220
220 -
 221
221 -
 222
222 -
 223
223 -
 224
224 -
 225
225 -
 226
226 -
 227
227 -
 228
228 -
 229
229 -
 230
230 -
 231
231 -
 232
232 -
 233
233 -
 234
234 -
 235
235 -
 236
236 -
 237
237 -
 238
238 -
 239
239 -
 240
240 -
241
-
242
-
243
-
244
 |
 |

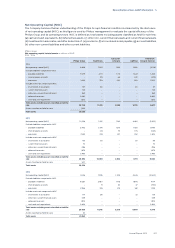
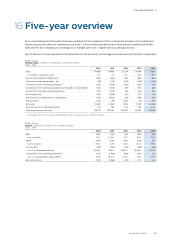
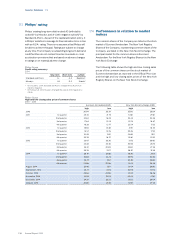
Five-year overview 16
230 Annual Report 2014
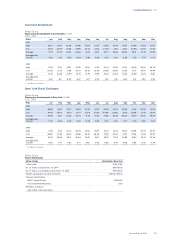
Philips Group
Capital employed in millions of EUR unless otherwise stated
2010 - 2014
2010 2011 2012 2013 2014
Cash and cash equivalents 5,833 3,147 3,834 2,465 1,873
Receivables and other current assets 5,324 5,570 5,156 5,262 5,606
Assets classied as held for sale 120 551 43 507 1,613
Inventories 3,865 3,625 3,495 3,240 3,314
Non-current nancial assets/investments in associates 660 549 726 657 619
Non-current receivables/assets 1,532 1,929 2,189 1,882 2,706
Property, plant and equipment 3,145 3,014 2,959 2,780 2,095
Intangible assets 12,233 11,012 10,679 9,766 10,526
Total assets 32,712 29,397 29,081 26,559 28,352
Property, plant and equipment:
Capital expenditures for the year 398 477 479 482 437
Depreciation for the year 538 525 588 521 592
Capital expenditures: depreciation 0.7 0.9 0.8 0.9 0.7
Inventories as a % of sales1) 16.0% 16.5% 14.1% 13.7% 15.5%
Inventories excluding discontinued operations 3,091 3,278 3,127 3,021 3,314
Outstanding trade receivables, in days sales1) 56 54 50 53 56
1) Calculated based upon the values excluding the businesses restated to discontinued operations
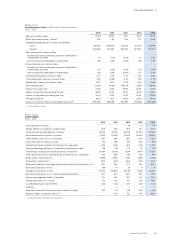
Philips Group
Financial structure in millions of EUR unless otherwise stated
2010 - 2014
2010 2011 2012 2013 2014
Other liabilities 10,610 10,434 10,379 8,529 9,486
Liabilities directly associated with assets held for sale – 61 27 348 349
Debt 4,658 3,860 4,534 3,901 4,104
Provisions 2,377 2,680 2,956 2,554 3,445
Total provisions and liabilities 17,645 17,035 17,896 15,332 17,384
Shareholders’ equity 15,021 12,328 11,151 11,214 10,867
Non-controlling interests 46 34 34 13 101
Group equity and liabilities 32,712 29,397 29,081 26,559 28,352
Net debt: group equity ratio (8):108 5:95 6:94 11:89 17:83
Market capitalization at year-end 21,694 15,077 18,200 24,340 22,082