Philips 2014 Annual Report Download - page 157
Download and view the complete annual report
Please find page 157 of the 2014 Philips annual report below. You can navigate through the pages in the report by either clicking on the pages listed below, or by using the keyword search tool below to find specific information within the annual report.-
 1
1 -
2
-
3
-
4
-
5
-
6
-
7
-
8
-
9
-
10
-
11
-
12
-
13
-
14
-
15
-
16
-
17
-
18
-
19
-
20
-
21
-
22
-
23
-
24
-
25
-
26
-
27
-
28
-
29
-
30
-
31
-
32
-
33
-
34
-
35
-
36
-
37
-
38
-
39
-
40
-
41
-
42
-
43
-
44
-
45
-
46
-
47
-
48
-
49
-
50
-
51
-
52
-
53
-
54
-
55
-
56
-
57
-
58
-
59
-
60
-
61
-
62
-
63
-
64
-
65
-
66
-
67
-
68
-
69
-
70
-
71
-
72
-
73
-
74
-
75
-
76
-
77
-
78
-
79
-
80
-
81
-
82
-
83
-
84
-
85
-
86
-
87
-
88
-
89
-
90
-
91
-
92
-
93
-
94
-
95
-
96
-
97
-
98
-
99
-
100
-
101
-
102
-
103
-
104
-
105
-
106
-
107
-
108
-
109
-
110
-
111
-
112
-
113
-
114
-
115
-
116
-
117
-
118
-
119
-
120
-
121
-
122
-
123
-
124
-
125
-
126
-
127
-
128
-
129
-
130
-
131
-
132
-
133
-
134
-
135
-
136
-
137
-
138
-
139
-
140
-
141
-
142
-
143
-
144
-
145
-
146
-
 147
147 -
 148
148 -
 149
149 -
 150
150 -
 151
151 -
 152
152 -
 153
153 -
 154
154 -
 155
155 -
 156
156 -
 157
157 -
 158
158 -
 159
159 -
 160
160 -
 161
161 -
 162
162 -
 163
163 -
 164
164 -
 165
165 -
 166
166 -
 167
167 -
168
-
169
-
170
-
171
-
172
-
173
-
174
-
175
-
176
-
177
-
178
-
179
-
180
-
181
-
182
-
183
-
184
-
185
-
186
-
187
-
188
-
189
-
190
-
191
-
192
-
193
-
194
-
195
-
196
-
197
-
198
-
199
-
200
-
201
-
202
-
203
-
204
-
205
-
206
-
207
-
208
-
209
-
210
-
211
-
212
-
213
-
214
-
215
-
216
-
217
-
218
-
219
-
220
-
221
-
222
-
223
-
224
-
225
-
226
-
227
-
228
-
229
-
230
-
231
-
232
-
233
-
234
-
235
-
236
-
237
-
238
-
239
-
240
-
241
-
242
-
243
-
244
 |
 |

21 Group nancial statements 12.9
Annual Report 2014 157
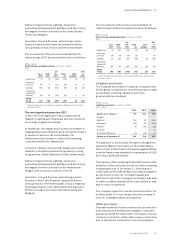
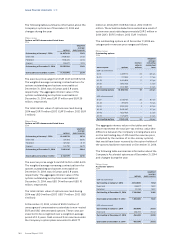
The funding of the pension fund in the Netherlands for
2015 consists of a xed percentage of payroll which
applies for a period of 5 years i.e. 2014-2018. The
remaining part of the EUR 600 million additional
contribution to the pension fund for the Netherlands for
2015 is not included in the above gures and is
estimated at EUR 167 million excluding interest.
The service and administration cost for 2015 is expected
to amount to EUR 332 million, consisting of EUR 331
million for dened-benet pension plans and EUR 1
million for dened-benet retiree medical plans. The
net interest expense for 2015 is expected to amount to
EUR 59 million, consisting of EUR 48 million for
dened-benet pension plans and EUR 11 million for
dened-benet retiree medical plans. The cost for
dened-contribution pension plans in 2015 is expected
to amount to EUR 140 million.
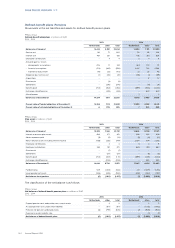
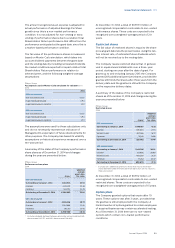
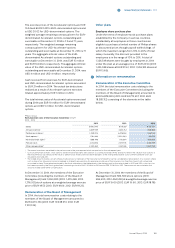
Sensitivity analysis
The table below illustrates the approximate impact on
the dened-benet obligation (DBO) if the Company
were to change key assumptions. The DBO was
recalculated using a change in the assumptions of 1%
which overall is considered a reasonably possible
change. The impact on the DBO because of changes in
discount rate is normally accompanied by osetting
movements in plan assets, especially when using
matching strategies.
Philips Group
Key assumptions in millions of EUR
2014
Dened benet obligation
Pension
Netherlands
Pension
other
Retiree
medical
Increase
Discount rate (1% movement) (2,309) (1,056) (18)
Wage change (1% movement) 107 31 –
Ination (1% movement) 1,341 555 –
Longevity (see explanation) 492 267 7
Medical benet level (1% price
increase) – – 14
Decrease
Discount rate (1% movement) 2,998 1,250 19
Wage change (1% movement) (132) (28) –
Ination (1% movement) (1,185) (486) –
Philips Group
Key assumptions in millions of EUR
2013
Dened benet obligation
Pension
Netherlands
Pension
other
Retiree
medical
Increase
Discount rate (1% movement) (1,708) (822) (12)
Wage change (1% movement) 165 28 –
Ination (1% movement) 979 461 –
Longevity (see explanation) 355 232 7
Medical benet level (1% price
increase) – – 12
Decrease
Discount rate (1% movement) 2,158 962 16
Wage change (1% movement) (147) (26) –
Ination (1% movement) (876) (418) –
Longevity also impacts post-employment dened-
benet obligation. The above sensitivity table
illustrates the impact on the dened-benet obligation
of a further 10% decrease in the assumed rates of
mortality for the Company’s major schemes. A 10%
decrease in assumed mortality rates equals
improvement of life expectancy by 0.5 - 1 year.
Changes in assumed health care cost trend rates can
have a signicant eect on the amounts reported for the
retiree medical plans. A 1%-point increase in medical
benet level is therefore included in the above table as
a likely scenario.
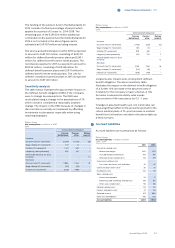
21 Accrued liabilities
Accrued liabilities are summarized as follows:
Philips Group
Accrued liabilities in millions of EUR
2013 - 2014
2013 2014
Personnel-related costs:
- Salaries and wages 560 502
- Accrued holiday entitlements 184 179
- Other personnel-related costs 130 119
Fixed-asset-related costs:
- Gas, water, electricity, rent and other 61 47
Communication and IT costs 38 51
Distribution costs 104 112
Sales-related costs:
- Commission payable 24 17
- Advertising and marketing-related costs 159 161
- Other sales-related costs 98 68
Material-related costs 175 132
Interest-related accruals 57 56
Deferred income 812 869
Other accrued liabilities 428 379
Accrued liabilities 2,830 2,692