Philips 2014 Annual Report Download - page 194
Download and view the complete annual report
Please find page 194 of the 2014 Philips annual report below. You can navigate through the pages in the report by either clicking on the pages listed below, or by using the keyword search tool below to find specific information within the annual report.-
 1
1 -
2
-
3
-
4
-
5
-
6
-
7
-
8
-
9
-
10
-
11
-
12
-
13
-
14
-
15
-
16
-
17
-
18
-
19
-
20
-
21
-
22
-
23
-
24
-
25
-
26
-
27
-
28
-
29
-
30
-
31
-
32
-
33
-
34
-
35
-
36
-
37
-
38
-
39
-
40
-
41
-
42
-
43
-
44
-
45
-
46
-
47
-
48
-
49
-
50
-
51
-
52
-
53
-
54
-
55
-
56
-
57
-
58
-
59
-
60
-
61
-
62
-
63
-
64
-
65
-
66
-
67
-
68
-
69
-
70
-
71
-
72
-
73
-
74
-
75
-
76
-
77
-
78
-
79
-
80
-
81
-
82
-
83
-
84
-
85
-
86
-
87
-
88
-
89
-
90
-
91
-
92
-
93
-
94
-
95
-
96
-
97
-
98
-
99
-
100
-
101
-
102
-
103
-
104
-
105
-
106
-
107
-
108
-
109
-
110
-
111
-
112
-
113
-
114
-
115
-
116
-
117
-
118
-
119
-
120
-
121
-
122
-
123
-
124
-
125
-
126
-
127
-
128
-
129
-
130
-
131
-
132
-
133
-
134
-
135
-
136
-
137
-
138
-
139
-
140
-
141
-
142
-
143
-
144
-
145
-
146
-
147
-
148
-
149
-
150
-
151
-
152
-
153
-
154
-
155
-
156
-
157
-
158
-
159
-
160
-
161
-
162
-
163
-
164
-
165
-
166
-
167
-
168
-
169
-
170
-
171
-
172
-
173
-
174
-
175
-
176
-
177
-
178
-
179
-
180
-
181
-
182
-
183
-
 184
184 -
 185
185 -
 186
186 -
 187
187 -
 188
188 -
 189
189 -
 190
190 -
 191
191 -
 192
192 -
 193
193 -
 194
194 -
 195
195 -
 196
196 -
 197
197 -
 198
198 -
 199
199 -
 200
200 -
 201
201 -
 202
202 -
 203
203 -
 204
204 -
205
-
206
-
207
-
208
-
209
-
210
-
211
-
212
-
213
-
214
-
215
-
216
-
217
-
218
-
219
-
220
-
221
-
222
-
223
-
224
-
225
-
226
-
227
-
228
-
229
-
230
-
231
-
232
-
233
-
234
-
235
-
236
-
237
-
238
-
239
-
240
-
241
-
242
-
243
-
244
 |
 |

Sustainability statements 14.2.3
194 Annual Report 2014
In-sourcing executive recruitment
Executive Search Services (ESS), Philips’ in-house
executive recruiting services division launched in
Q1 2014, delivered 80 high-quality senior-level hires
in 2014. ESS provides services such as demand-based
executive recruiting, executive intelligence & talent
consulting services, and executive-specic referral and
onboarding programs. The addition of this focused in-
house recruiting capability ensures we are able to oer
the most appropriate service to our internal customers.
A strong employer brand as a driver for talent
attraction
Philips realizes that it is crucial to attract the best talent
in order to deliver on our strategic goals. In 2014 we
activated our global Employer Value Proposition by
leveraging our recently re-positioned ‘innovation and
you’ brand platform, aligned with audience insights to
raise awareness and preference. For employer brand
updates and company content, visit
the Philips LinkedIn Careers page.
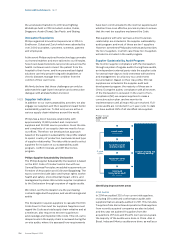
As part of its global Talent Acquisition strategy, Philips
seeks to attract talent from proven high quality sources.
In 2014, the top 5 sources of hire were:
▪Philips employee referral – Historical data has
proven that the top performing hires for Philips are
those referred by its own employees. Philips engages
its employees to share their network through a formal
employee referral program which generates close to
30% of its total hires each year.
▪Internal hire – Embedded within the Accelerate!
Transformation is a stated cultural imperative to
embed a growth and performance culture and
facilitate a mobile, diverse workforce. As a result,
Philips lled nearly one third of its vacancies with
internal top performers each year.
▪Proactively sourced by recruiter – Philips has a
dedicated in-house sourcing function that focuses
solely on building proactive talent pipelines and
requires all its recruitment professionals to contribute
to the proactive identication of passive industry
talent.
▪Digital career channel (job board, social media site,
etc.) – In line with the company’s overall focus on
increasing its digital footprint, Philips’ recruitment
marketing team invested more heavily in its digital
footprint in 2014. As a result, Philips increased its
LinkedIn Talent Brand Index by 2.1% and delivered
over 1,000 hired candidates.
▪Philips careers website – Philips career website
attracts talent by emphasizing its Employer Value
Proposition through targeted information sharing
and storytelling from its employees and leadership
teams. Philips global career website can be found
at www.philips.com/careers.
14.2.4 Health and Safety performance
A number of sites showed outstanding safety
performance, for example the Healthcare Pune site in
India, which reached a signicant milestone by
achieving over 2 million man-hours without an LWIC by
the end of 2014 (over 2 years without an accident). The
Consumer Lifestyle facility in Varginha, Brazil achieved
4 years without an LWIC by the end of 2014.
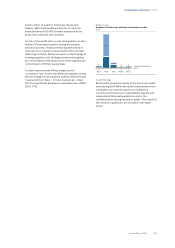
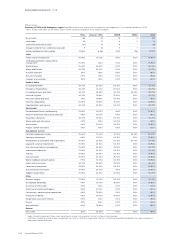
Philips Group
Lost workday injuries per 100 FTEs
2010 - 2014
2010 2011 2012 2013 2014
Healthcare 0.25 0.20 0.22 0.19 0.20
Consumer Lifestyle 0.26 0.23 0.25 0.24 0.12
Lighting 0.73 0.67 0.47 0.42 0.37
Innovation, Group &
Services 0.13 0.04 0.05 0.04 0.02
Continuing
operations 0.45 0.38 0.31 0.27 0.23
Discontinued
operations 0.84 0.59 0.55 0.37 0.25
Philips Group 0.50 0.38 0.31 0.28 0.23
Lighting
Lighting achieved a strong decline in reported accident
rates in recent years. In 2014, the number of LWIC
decreased to 132, compared with 165 in 2013. The LWIC
rate decreased to 0.37, compared with 0.42 in 2013. The
number of Lost Workdays decreased by 3% to 4,700
days. One major achievement was a zero level of LWIC
at 12 signicant industrial units (over 100 FTEs) in 2014.
Eorts are being made to further reduce these rates
through an emphasis on prevention and Behavior-
Based Safety, supported by senior management
involvement.
In 2014, Health and Safety management in Turnkey
Lighting projects was a key focus area. A Health and
Safety global framework has been launched to support
and provide training for project managers and their
teams in the commercial organizations, including
contractors. This framework will continue to be rolled
out in 2015.
Healthcare
The Health and Safety performance of Healthcare was
relatively stable in 2014. The number of LWIC and the
LWIC rate remained constant compared to 2013 at 72
and 0.2 respectively. However, the total number of Lost
Workdays decreased by 10% year-on-year to 2,242
days. Healthcare continued to focus on Health and
Safety improvement actions within their Field Service
Organization (FSO), including the launch of a
formalized Health and Safety management framework
as well as the deployment of renewed targeted
trainings for high-risk areas such as radiation and
electrical safety. FSO Lost Workdays decreased to 33%
of the Sector total compared with 37% in 2013, although
the number of LWIC increased to 31 from 28 in 2013.
Consumer Lifestyle
Consumer Lifestyle showed a signicant decrease in
LWIC from 39 in 2013 to 21 in 2014. The LWIC rate fell by
49% year-on-year to an internal benchmark level of
0.12. The number of Lost Workdays increased, however,
from 842 to 1,608 days as recovery periods increased.