Philips 2014 Annual Report Download - page 5
Download and view the complete annual report
Please find page 5 of the 2014 Philips annual report below. You can navigate through the pages in the report by either clicking on the pages listed below, or by using the keyword search tool below to find specific information within the annual report.-
 1
1 -
 2
2 -
 3
3 -
 4
4 -
 5
5 -
 6
6 -
 7
7 -
 8
8 -
 9
9 -
 10
10 -
 11
11 -
 12
12 -
 13
13 -
 14
14 -
 15
15 -
 16
16 -
17
-
18
-
19
-
20
-
21
-
22
-
23
-
24
-
25
-
26
-
27
-
28
-
29
-
30
-
31
-
32
-
33
-
34
-
35
-
36
-
37
-
38
-
39
-
40
-
41
-
42
-
43
-
44
-
45
-
46
-
47
-
48
-
49
-
50
-
51
-
52
-
53
-
54
-
55
-
56
-
57
-
58
-
59
-
60
-
61
-
62
-
63
-
64
-
65
-
66
-
67
-
68
-
69
-
70
-
71
-
72
-
73
-
74
-
75
-
76
-
77
-
78
-
79
-
80
-
81
-
82
-
83
-
84
-
85
-
86
-
87
-
88
-
89
-
90
-
91
-
92
-
93
-
94
-
95
-
96
-
97
-
98
-
99
-
100
-
101
-
102
-
103
-
104
-
105
-
106
-
107
-
108
-
109
-
110
-
111
-
112
-
113
-
114
-
115
-
116
-
117
-
118
-
119
-
120
-
121
-
122
-
123
-
124
-
125
-
126
-
127
-
128
-
129
-
130
-
131
-
132
-
133
-
134
-
135
-
136
-
137
-
138
-
139
-
140
-
141
-
142
-
143
-
144
-
145
-
146
-
147
-
148
-
149
-
150
-
151
-
152
-
153
-
154
-
155
-
156
-
157
-
158
-
159
-
160
-
161
-
162
-
163
-
164
-
165
-
166
-
167
-
168
-
169
-
170
-
171
-
172
-
173
-
174
-
175
-
176
-
177
-
178
-
179
-
180
-
181
-
182
-
183
-
184
-
185
-
186
-
187
-
188
-
189
-
190
-
191
-
192
-
193
-
194
-
195
-
196
-
197
-
198
-
199
-
200
-
201
-
202
-
203
-
204
-
205
-
206
-
207
-
208
-
209
-
210
-
211
-
212
-
213
-
214
-
215
-
216
-
217
-
218
-
219
-
220
-
221
-
222
-
223
-
224
-
225
-
226
-
227
-
228
-
229
-
230
-
231
-
232
-
233
-
234
-
235
-
236
-
237
-
238
-
239
-
240
-
241
-
242
-
243
-
244
 |
 |
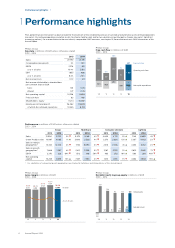
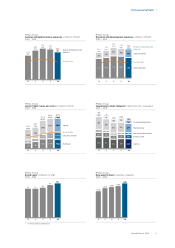
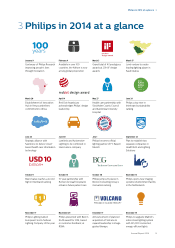
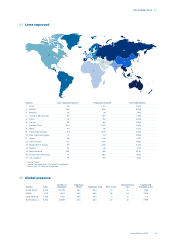
Performance highlights 1
Annual Report 2014 5
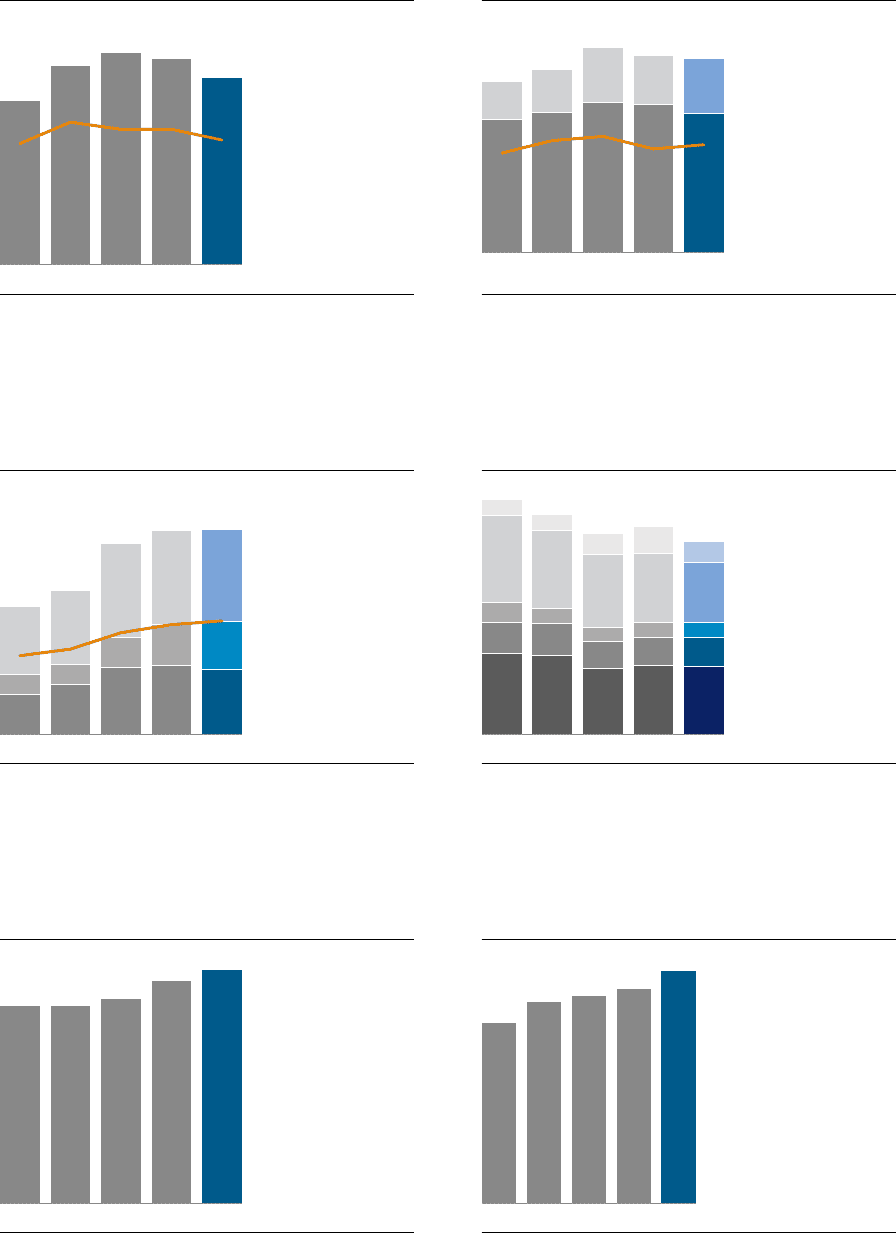
Philips Group
General and administrative expenses in millions of EUR
2010 - 2014
657
‘10
3.4%
795
‘11
4.0% 847
‘12
3.8%
825
‘13
3.8%
747 General and administrative
expenses
‘14
3.5%
As a % of sales
Philips Group
Green Product sales per sector in millions of EUR
2010 - 2014
2,136
1,067
3,696
6,899
35.8%
‘10
2,663
1,101
3,955
7,719
38.8%
‘11
3,610
1,619
5,056
10,285
46.3%
‘12
3,690
2,270
5,037
10,997
50.0%
‘13
3,508 Healthcare
2,605 Consumer Lifestyle
4,952 Lighting
11,065
51.7%
‘14
As a % of sales
Philips Group
Brand value1) in billions of USD
2010 - 2014
8.7
‘10
8.7
‘11
9.0
‘12
9.8
‘13
10.3
‘14
1) As measured by Interbrand
Philips Group
Research and development expenses in millions of EUR
2010 - 2014
1,123
313
1,436
7.4%
‘10
1,180
363
1,543
7.7%
‘11
1,271
453
1,724
7.8%
‘12
1,254
405
1,659
7.5%
‘13
1,172 Other Innovation
463 Green Innovation
1,635 Research and development
expenses
7.6%
‘14
As a % of sales
Philips Group
Operational carbon footprint in kilotonnes CO2-equivalent
2010 - 2014
649
246
163
698
121
1,877
‘10
632
256
119
628
118
1,753
‘11
525
216
118
582
160
1,601
‘12
550
226
117
558
213
1,664
‘13
545 Logistics
227 Business travel
124 Non-industrial operations
479 Manufacturing
168 Discontinued operations
1,543
‘14
Philips Group
New patents led in number of patents
2010 - 2014
1,300
‘10
1,450
‘11
1,500
‘12
1,550
‘13
1,680
‘14