Philips 2014 Annual Report Download - page 48
Download and view the complete annual report
Please find page 48 of the 2014 Philips annual report below. You can navigate through the pages in the report by either clicking on the pages listed below, or by using the keyword search tool below to find specific information within the annual report.-
 1
1 -
2
-
3
-
4
-
5
-
6
-
7
-
8
-
9
-
10
-
11
-
12
-
13
-
14
-
15
-
16
-
17
-
18
-
19
-
20
-
21
-
22
-
23
-
24
-
25
-
26
-
27
-
28
-
29
-
30
-
31
-
32
-
33
-
34
-
35
-
36
-
37
-
 38
38 -
 39
39 -
 40
40 -
 41
41 -
 42
42 -
 43
43 -
 44
44 -
 45
45 -
 46
46 -
 47
47 -
 48
48 -
 49
49 -
 50
50 -
 51
51 -
 52
52 -
 53
53 -
 54
54 -
 55
55 -
 56
56 -
 57
57 -
 58
58 -
59
-
60
-
61
-
62
-
63
-
64
-
65
-
66
-
67
-
68
-
69
-
70
-
71
-
72
-
73
-
74
-
75
-
76
-
77
-
78
-
79
-
80
-
81
-
82
-
83
-
84
-
85
-
86
-
87
-
88
-
89
-
90
-
91
-
92
-
93
-
94
-
95
-
96
-
97
-
98
-
99
-
100
-
101
-
102
-
103
-
104
-
105
-
106
-
107
-
108
-
109
-
110
-
111
-
112
-
113
-
114
-
115
-
116
-
117
-
118
-
119
-
120
-
121
-
122
-
123
-
124
-
125
-
126
-
127
-
128
-
129
-
130
-
131
-
132
-
133
-
134
-
135
-
136
-
137
-
138
-
139
-
140
-
141
-
142
-
143
-
144
-
145
-
146
-
147
-
148
-
149
-
150
-
151
-
152
-
153
-
154
-
155
-
156
-
157
-
158
-
159
-
160
-
161
-
162
-
163
-
164
-
165
-
166
-
167
-
168
-
169
-
170
-
171
-
172
-
173
-
174
-
175
-
176
-
177
-
178
-
179
-
180
-
181
-
182
-
183
-
184
-
185
-
186
-
187
-
188
-
189
-
190
-
191
-
192
-
193
-
194
-
195
-
196
-
197
-
198
-
199
-
200
-
201
-
202
-
203
-
204
-
205
-
206
-
207
-
208
-
209
-
210
-
211
-
212
-
213
-
214
-
215
-
216
-
217
-
218
-
219
-
220
-
221
-
222
-
223
-
224
-
225
-
226
-
227
-
228
-
229
-
230
-
231
-
232
-
233
-
234
-
235
-
236
-
237
-
238
-
239
-
240
-
241
-
242
-
243
-
244
 |
 |

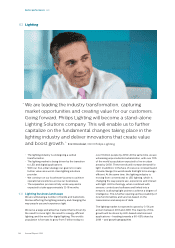
Sector performance 6.1.4
48 Annual Report 2014
issues, on January 10, 2014 we started a voluntary,
temporary suspension of new production at the facility,
primarily to strengthen manufacturing process controls.
The suspension negatively impacted Healthcare’s sales
and EBITA in 2014.
On October 3, 2014 Philips announced that it would
appeal the jury verdict in the patent infringement
lawsuit by Masimo Corporation (Masimo), in which
Masimo was awarded compensation of USD 467 million
(EUR 366 million). The jury verdict is part of extensive
litigation, which started in 2009, between Masimo and
Philips involving several claims and counterclaims
related to a large number of patents.
EBITA in 2013 also included EUR 61 million from a past-
service pension gain and a EUR 21 million gain on the
sale of a business excluding these items. The decrease
in EBITA was mainly driven by operational losses
related to the voluntary suspension of production at the
Cleveland facility and negative currency impacts.
EBIT amounted to EUR 456 million, or 5.0% of sales, and
included EUR 159 million of charges related to
intangible assets.
Net operating capital increased by EUR 128 million to
EUR 7,565 million. Higher provisions and lower xed
assets were oset by currency impacts.
Cash ows before nancing activities decreased from
EUR 1,292 million in 2013 to EUR 910 million in 2014,
largely due to lower earnings.
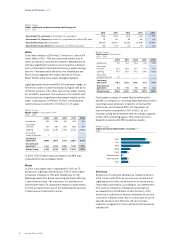
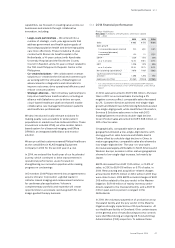
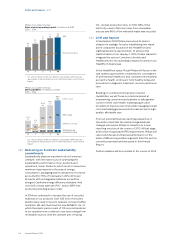
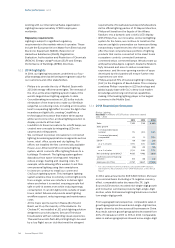
Philips Healthcare
Sales per geographic cluster in millions of EUR
2010 - 2014
2,031
3,901
968
1,701
8,601
‘10
1,948
3,953
1,046
1,905
8,852
‘11
1,970
4,393
1,252
2,368
9,983
‘12
1,932
4,089
1,133
2,421
9,575
‘13
1,914 Western Europe
3,896 North America
1,080 Other mature
2,296 Growth
9,186
‘14
Philips Healthcare
Sales and net operating capital1) in billions of EUR
2010 - 2014
8.6
‘10
8.9 8.9
‘11
8.4 10.0
‘12
8.0
9.6
‘13
7.4
9.2 Sales
‘14
7.6
Net operating capital
1) For a reconciliation to the most directly comparable GAAP measures,
see chapter 15, Reconciliation of non-GAAP information, of this Annual
Report
Philips Healthcare
EBIT and EBITA 1) in millions of EUR
2010 - 2014
263
866
1,129
13.1%
‘10
1,053
27
1,080
12.2%
‘11
200
1,026
1,226
12.3%
‘12
197
1,315
1,512
15.8%
‘13
160 Amortization and impairment
in value
456 EBIT in value
616 EBITA in value
6.7%
‘14
EBITA as a % of sales
1) For a reconciliation to the most directly comparable GAAP measures,
see chapter 15, Reconciliation of non-GAAP information, of this Annual
Report
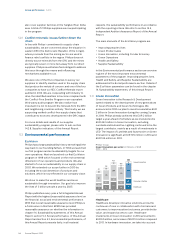
6.1.5 Delivering on EcoVision sustainability
commitments
The increasing population and rising levels of human
development worldwide pose a number of challenges,
such as scarcity of natural resources, pollution, and
stressed health care systems. Philips Healthcare
continues to help increase the number of lives
improved annually around the globe by developing
solutions that improve access to care, while at the same
time respecting the boundaries of natural resources.
In 2014, Green Product sales in Healthcare amounted
to EUR 3.5 billion and we introduced seven new Green
Products to support energy eciency, materials
reduction and other sustainability goals. We are also
actively collaborating with care providers to look for
innovative ways to reduce the environmental impact of
health care, for example by improving the energy
eciency of medical equipment. Another example is
the launch of a new imaging systems refurbishment
facility in Best, the Netherlands, in support of the
transition to a circular economy in Healthcare.