Philips 2014 Annual Report Download - page 163
Download and view the complete annual report
Please find page 163 of the 2014 Philips annual report below. You can navigate through the pages in the report by either clicking on the pages listed below, or by using the keyword search tool below to find specific information within the annual report.-
 1
1 -
2
-
3
-
4
-
5
-
6
-
7
-
8
-
9
-
10
-
11
-
12
-
13
-
14
-
15
-
16
-
17
-
18
-
19
-
20
-
21
-
22
-
23
-
24
-
25
-
26
-
27
-
28
-
29
-
30
-
31
-
32
-
33
-
34
-
35
-
36
-
37
-
38
-
39
-
40
-
41
-
42
-
43
-
44
-
45
-
46
-
47
-
48
-
49
-
50
-
51
-
52
-
53
-
54
-
55
-
56
-
57
-
58
-
59
-
60
-
61
-
62
-
63
-
64
-
65
-
66
-
67
-
68
-
69
-
70
-
71
-
72
-
73
-
74
-
75
-
76
-
77
-
78
-
79
-
80
-
81
-
82
-
83
-
84
-
85
-
86
-
87
-
88
-
89
-
90
-
91
-
92
-
93
-
94
-
95
-
96
-
97
-
98
-
99
-
100
-
101
-
102
-
103
-
104
-
105
-
106
-
107
-
108
-
109
-
110
-
111
-
112
-
113
-
114
-
115
-
116
-
117
-
118
-
119
-
120
-
121
-
122
-
123
-
124
-
125
-
126
-
127
-
128
-
129
-
130
-
131
-
132
-
133
-
134
-
135
-
136
-
137
-
138
-
139
-
140
-
141
-
142
-
143
-
144
-
145
-
146
-
147
-
148
-
149
-
150
-
151
-
152
-
 153
153 -
 154
154 -
 155
155 -
 156
156 -
 157
157 -
 158
158 -
 159
159 -
 160
160 -
 161
161 -
 162
162 -
 163
163 -
 164
164 -
 165
165 -
 166
166 -
 167
167 -
 168
168 -
 169
169 -
 170
170 -
 171
171 -
 172
172 -
 173
173 -
174
-
175
-
176
-
177
-
178
-
179
-
180
-
181
-
182
-
183
-
184
-
185
-
186
-
187
-
188
-
189
-
190
-
191
-
192
-
193
-
194
-
195
-
196
-
197
-
198
-
199
-
200
-
201
-
202
-
203
-
204
-
205
-
206
-
207
-
208
-
209
-
210
-
211
-
212
-
213
-
214
-
215
-
216
-
217
-
218
-
219
-
220
-
221
-
222
-
223
-
224
-
225
-
226
-
227
-
228
-
229
-
230
-
231
-
232
-
233
-
234
-
235
-
236
-
237
-
238
-
239
-
240
-
241
-
242
-
243
-
244
 |
 |

Group nancial statements 12.9
Annual Report 2014 163
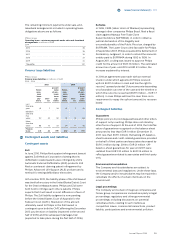
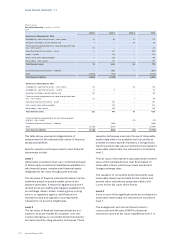
The amount recognized as an expense is adjusted for
actual performance of adjusted Earnings Per Share
growth since this is a non-market performance
condition. It is not adjusted for non-vesting or extra
vesting of performance shares due to a relative Total
Shareholders’ Return performance that diers from the
performance anticipated at the grant date, since this is
a market-based performance condition.
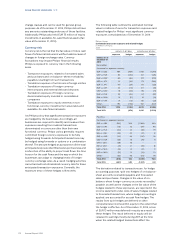
The fair value of the performance shares is measured
based on Monte-Carlo simulation, which takes into
account dividend payments between the grant date
and the vesting date by including reinvested dividends,
the market conditions expected to impact relative Total
Shareholders’ Return performance in relation to
selected peers, and the following weighted-average
assumptions:
Philips Group
Assumptions used in Monte-Carlo simulation for valuation in %
2014
2014
EUR-denominated
Risk-free interest rate 0.35%
Expected dividend yield 3.9%
Expected share price volatility 25%
USD-denominated
Risk-free interest rate 0.35%
Expected dividend yield 3.9%
Expected share price volatility 27%
The assumptions were used for these calculations only
and do not necessarily represent an indication of
Management’s expectation of future developments for
other purposes. The Company has based its volatility
assumptions on historical experience measured over a
ten-year period.
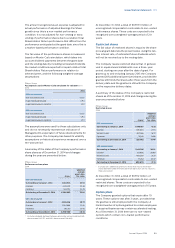
A summary of the status of the Company’s performance
share plans as of December 31, 2014 and changes
during the year are presented below:
Philips Group
Performance share plans
2014
shares1)
weighted
average
grant-date
fair value
EUR-denominated
Outstanding at January 1, 2014 3,442,923 23.53
Granted 3,405,781 22.36
Forfeited 544,702 23.29
Outstanding at December 31, 2014 6,304,002 22.92
USD-denominated
Outstanding at January 1, 2014 2,298,226 30.77
Granted 2,264,889 30.10
Forfeited 362,215 30.42
Outstanding at December 31, 2014 4,200,900 30.44
1) Excludes dividend declared between grant date and vesting date (EUR-
denominated: 332,757 and USD-denominated: 238,833)
At December 31, 2014, a total of EUR 173 million of
unrecognized compensation costs relate to non-vested
performance shares. These costs are expected to be
recognized over a weighted-average period of 2.0
years.
Restricted shares
The fair value of restricted shares is equal to the share
price at grant date less the present value, using the risk-
free interest rate, of estimated future dividends which
will not be received up to the vesting date.
The Company issues restricted shares that, in general,
vest in equal annual installments over a three-year
period, starting one year after the date of grant. For
grants up to and including January 2013 the Company
granted 20% additional (premium) shares, provided the
grantee still holds the shares after three years from the
delivery date and the grantee is still with the Company
on the respective delivery dates.
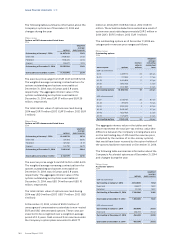
A summary of the status of the Company’s restricted
shares as of December 31, 2014 and changes during the
year are presented below:
Philips Group
Restricted shares
2014
shares1)
weighted
average
grant-date
fair value
EUR-denominated
Outstanding at January 1, 2014 1,065,169 15.31
Granted 169,800 21.93
Vested/Issued 657,566 16.19
Forfeited 51,941 14.66
Outstanding at December 31, 2014 525,462 16.44
USD-denominated
Outstanding at January 1, 2014 1,140,246 20.33
Granted 173,906 29.99
Vested/Issued 642,209 21.27
Forfeited 71,264 25.47
Outstanding at December 31, 2014 600,679 21.51
1) Excludes 20% additional (premium) shares that may be received if
shares delivered under the restricted share rights plan are not sold for a
three-year period
At December 31, 2014, a total of EUR 12 million of
unrecognized compensation costs relate to non-vested
restricted shares. These costs are expected to be
recognized over a weighted-average period of 1.5 years.
Option plans
The Company granted options that expire after 10
years. These options vest after 3 years, provided that
the grantee is still employed with the Company. A
limited number of options granted to certain employees
of acquired business may contain accelerated vesting.
As of December 31, 2014 there are no non-vested
options which contain non-market performance
conditions.