Philips 2014 Annual Report Download - page 190
Download and view the complete annual report
Please find page 190 of the 2014 Philips annual report below. You can navigate through the pages in the report by either clicking on the pages listed below, or by using the keyword search tool below to find specific information within the annual report.-
 1
1 -
2
-
3
-
4
-
5
-
6
-
7
-
8
-
9
-
10
-
11
-
12
-
13
-
14
-
15
-
16
-
17
-
18
-
19
-
20
-
21
-
22
-
23
-
24
-
25
-
26
-
27
-
28
-
29
-
30
-
31
-
32
-
33
-
34
-
35
-
36
-
37
-
38
-
39
-
40
-
41
-
42
-
43
-
44
-
45
-
46
-
47
-
48
-
49
-
50
-
51
-
52
-
53
-
54
-
55
-
56
-
57
-
58
-
59
-
60
-
61
-
62
-
63
-
64
-
65
-
66
-
67
-
68
-
69
-
70
-
71
-
72
-
73
-
74
-
75
-
76
-
77
-
78
-
79
-
80
-
81
-
82
-
83
-
84
-
85
-
86
-
87
-
88
-
89
-
90
-
91
-
92
-
93
-
94
-
95
-
96
-
97
-
98
-
99
-
100
-
101
-
102
-
103
-
104
-
105
-
106
-
107
-
108
-
109
-
110
-
111
-
112
-
113
-
114
-
115
-
116
-
117
-
118
-
119
-
120
-
121
-
122
-
123
-
124
-
125
-
126
-
127
-
128
-
129
-
130
-
131
-
132
-
133
-
134
-
135
-
136
-
137
-
138
-
139
-
140
-
141
-
142
-
143
-
144
-
145
-
146
-
147
-
148
-
149
-
150
-
151
-
152
-
153
-
154
-
155
-
156
-
157
-
158
-
159
-
160
-
161
-
162
-
163
-
164
-
165
-
166
-
167
-
168
-
169
-
170
-
171
-
172
-
173
-
174
-
175
-
176
-
177
-
178
-
179
-
 180
180 -
 181
181 -
 182
182 -
 183
183 -
 184
184 -
 185
185 -
 186
186 -
 187
187 -
 188
188 -
 189
189 -
 190
190 -
 191
191 -
 192
192 -
 193
193 -
 194
194 -
 195
195 -
 196
196 -
 197
197 -
 198
198 -
 199
199 -
 200
200 -
201
-
202
-
203
-
204
-
205
-
206
-
207
-
208
-
209
-
210
-
211
-
212
-
213
-
214
-
215
-
216
-
217
-
218
-
219
-
220
-
221
-
222
-
223
-
224
-
225
-
226
-
227
-
228
-
229
-
230
-
231
-
232
-
233
-
234
-
235
-
236
-
237
-
238
-
239
-
240
-
241
-
242
-
243
-
244
 |
 |

Sustainability statements 14
190 Annual Report 2014
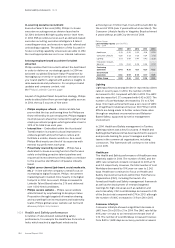
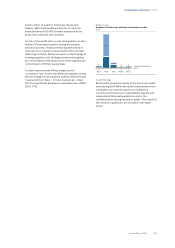
Programs and targets
Our sustainability commitments are grouped under the
label EcoVision, comprising the following key elements,
more detailed targets can be found in the respective
sections.
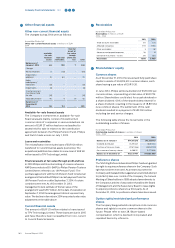
Philips Group
Sustainability commitments
2014
target 2015
baseline
year
Green Product Sales 50% of total sales
Lives Improved 2 billion
Green Innovation
- Investments EUR 2 billion (cumulative) 2010
- Energy Eciency 50.3 lumen/watt (up 50%) 2009
- Materials
- Collection &
Recycling 45,000 tonnes (up 100%) 2009
- Recycled content 15,000 tonnes (up 100%) 2009
Green Operations
- CO2 reduction 40% 2007
- Health & Safety 0.26 Lost Workday Injury
Cases per 100 FTE
Supplier Sustainability 1) 72% compliant
1) For more information see sub-section 14.2.8, Supplier indicators, of this
Annual Report
All of our programs are guided by the Philips General
Business Principles, which provide the framework for all
of our business decisions and actions.
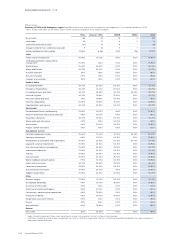
Boundaries of sustainability reporting
Our sustainability performance reporting encompasses
the consolidated Philips Group activities, following the
consolidation criteria detailed in this section. As a result
of impact assessments of our value chain we have
identied the material topics, determined their relative
impact in the value chain (supply chain, our own
operations, and use phase of our products) and report
for each topic on the relevant parts of the value chain.
More details on our impact are provided in the relevant
sections.
The consolidated selected nancial information in this
sustainability statements section has been derived
from the Group Financial Statements, which are based
on IFRS.
Comparability and completeness
We used expert opinions and estimates for some parts
of the Key Performance Indicator calculations. There is
therefore an inherent uncertainty in our calculations.
The gures reported are Philips’ best estimate. As our
insight increases, we may enhance the methodology in
the future.
Social data cover all employees, including temporary
employees, but exclude contract workers. Due to the
implementation of new HRM systems, we are able to
provide more specic exit information on Philips
employees as from 2014. Historical comparisons may
not be available, however.
In 2014 the latest DEFRA (UK Department of
Environment, Food and Rural Aairs) natural gas
emission factor has been applied to the 2014 reporting
period. This had an upward impact year-on-year on our
CO2 emissions of some 0.6%.
The emissions of substances data is based on
measurements and estimates at manufacturing site
level. There is therefore an inherent uncertainty in our
calculations. The gures reported are Philips’ best
estimate. As our insight increases, we may enhance the
methodology in the future.
Integration of newly acquired activities is scheduled
according to a dened integration timetable (in
principle, rst full reporting year after the year of
acquisition) and subject to the integration agenda. Data
for activities that are divested during the reporting year
are not included in full-year reporting. Environmental
data are reported for manufacturing sites with more
than 50 industrial employees.
In line with the discontinued operations presentation in
the Group nancial statements regarding the Lumileds
and Automotive business, we have excluded this data
from the consolidated Sustainability data if relevant.
Where the impact of the exclusion was material, we
clearly disclosed the impact.
Prior-period sustainability data have been restated
where relevant for the treatment of the Lumileds and
Automotive business as discontinued operations. As a
result, baseline adjustments have been made for Lives
Improved, Energy Eciency, Carbon Footprint and
environmental indicators (energy, water, waste and
emissions).
Data denitions and scope
Lives improved, energy eciency and materials
The Key Performance Indicators on ‘lives improved’,
‘energy eciency’ and ‘materials’ and the scope are
dened in the respective methodology documents that
can be found at www.philips.com/sustainability.
Health and safety
Health and safety data is reported for units with over 50
FTEs (full-time equivalents) and is voluntary for smaller
units. Health and safety data are reported and
validated monthly. The focus is on reporting work-
related injuries, which predominantly occur in
manufacturing operations and Field Services
Organizations. The annual number of cases leading to
at least one lost workday is reported per 100 FTEs (full-
time equivalents). Fatalities are reported for sta,
contractors and visitors and include commuting
accidents.
General Business Principles
Alleged GBP violations are registered in our intranet-
based reporting and validation tool.