Philips 2014 Annual Report Download - page 164
Download and view the complete annual report
Please find page 164 of the 2014 Philips annual report below. You can navigate through the pages in the report by either clicking on the pages listed below, or by using the keyword search tool below to find specific information within the annual report.-
 1
1 -
2
-
3
-
4
-
5
-
6
-
7
-
8
-
9
-
10
-
11
-
12
-
13
-
14
-
15
-
16
-
17
-
18
-
19
-
20
-
21
-
22
-
23
-
24
-
25
-
26
-
27
-
28
-
29
-
30
-
31
-
32
-
33
-
34
-
35
-
36
-
37
-
38
-
39
-
40
-
41
-
42
-
43
-
44
-
45
-
46
-
47
-
48
-
49
-
50
-
51
-
52
-
53
-
54
-
55
-
56
-
57
-
58
-
59
-
60
-
61
-
62
-
63
-
64
-
65
-
66
-
67
-
68
-
69
-
70
-
71
-
72
-
73
-
74
-
75
-
76
-
77
-
78
-
79
-
80
-
81
-
82
-
83
-
84
-
85
-
86
-
87
-
88
-
89
-
90
-
91
-
92
-
93
-
94
-
95
-
96
-
97
-
98
-
99
-
100
-
101
-
102
-
103
-
104
-
105
-
106
-
107
-
108
-
109
-
110
-
111
-
112
-
113
-
114
-
115
-
116
-
117
-
118
-
119
-
120
-
121
-
122
-
123
-
124
-
125
-
126
-
127
-
128
-
129
-
130
-
131
-
132
-
133
-
134
-
135
-
136
-
137
-
138
-
139
-
140
-
141
-
142
-
143
-
144
-
145
-
146
-
147
-
148
-
149
-
150
-
151
-
152
-
153
-
 154
154 -
 155
155 -
 156
156 -
 157
157 -
 158
158 -
 159
159 -
 160
160 -
 161
161 -
 162
162 -
 163
163 -
 164
164 -
 165
165 -
 166
166 -
 167
167 -
 168
168 -
 169
169 -
 170
170 -
 171
171 -
 172
172 -
 173
173 -
 174
174 -
175
-
176
-
177
-
178
-
179
-
180
-
181
-
182
-
183
-
184
-
185
-
186
-
187
-
188
-
189
-
190
-
191
-
192
-
193
-
194
-
195
-
196
-
197
-
198
-
199
-
200
-
201
-
202
-
203
-
204
-
205
-
206
-
207
-
208
-
209
-
210
-
211
-
212
-
213
-
214
-
215
-
216
-
217
-
218
-
219
-
220
-
221
-
222
-
223
-
224
-
225
-
226
-
227
-
228
-
229
-
230
-
231
-
232
-
233
-
234
-
235
-
236
-
237
-
238
-
239
-
240
-
241
-
242
-
243
-
244
 |
 |

Group nancial statements 12.9
164 Annual Report 2014
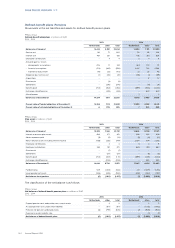
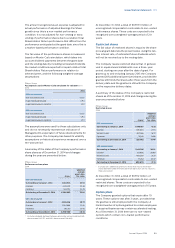
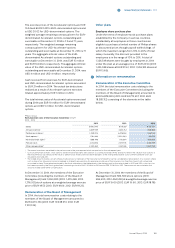
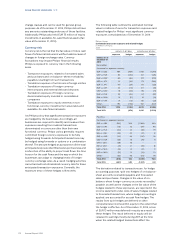
The following tables summarize information about the
Company’s options as of December 31, 2014 and
changes during the year:
Philips Group
Options on EUR-denominated listed share
2014
options
weighted
average
exercise price
Outstanding at January 1, 2014 18,657,828 21.63
Exercised 2,436,583 21.03
Forfeited 908,220 22.33
Expired 236,071 24.13
Outstanding at December 31, 2014 15,076,954 21.65
Exercisable at December 31, 2014 11,763,646 23.54
The exercise prices range from EUR 12.63 to EUR 32.04.
The weighted average remaining contractual term for
options outstanding and options exercisable at
December 31, 2014, was 4.6 years and 3.8 years,
respectively. The aggregate intrinsic value of the
options outstanding and options exercisable at
December 31, 2014, was EUR 57 million and EUR 26
million, respectively.
The total intrinsic value of options exercised during
2014 was EUR 11 million (2013: EUR 15 million, 2012: EUR
3 million).
Philips Group
Options on USD-denominated listed share
2014
options
weighted
average
exercise price
Outstanding at January 1, 2014 13,449,570 29.74
Exercised 1,271,182 28.00
Forfeited 675,761 31.37
Expired 140,791 28.79
Outstanding at December 31, 2014 11,361,836 29.84
Exercisable at December 31, 2014 8,724,979 32.93
The exercise prices range from USD 16.76 to USD 44.15.
The weighted average remaining contractual term for
options outstanding and options exercisable at
December 31, 2014, was 4.6 years and 3.8 years,
respectively. The aggregate intrinsic value of the
options outstanding and options exercisable at
December 31, 2014, was USD 34 million and USD 10
million, respectively.
The total intrinsic value of options exercised during
2014 was USD 9 million (2013: USD 17 million, 2012: USD
4 million).
At December 31, 2014, a total of EUR 2 million of
unrecognized compensation costs relate to non-vested
EUR and USD denominated options. These costs are
expected to be recognized over a weighted-average
period of 0.3 years. Cash received from exercises under
the Company’s option plans amounted to EUR 77
million in 2014 (2013: EUR 84 million, 2012: EUR 19
million. The actual tax deductions realized as a result of
option exercises totaled approximately EUR 3 million in
2014 (2013: EUR 5 million, 2012: EUR 1 million).
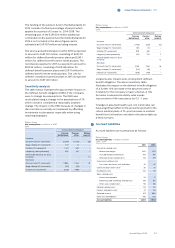
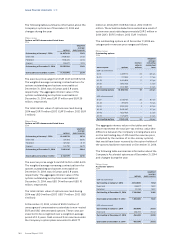
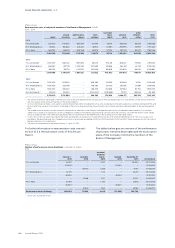
The outstanding options as of December 31,2014 are
categorized in exercise price ranges as follows:
Philips Group
Outstanding options
2014
exercise price options
intrinsic
value in
millions
weighted
average
remaining
contractual
term
EUR-denominated
10-15 4,259,713 42 6.6 yrs
15-20 777,934 4 1.7 yrs
20-25 6,413,918 11 5.2 yrs
25-30 1,502,505 – 1.3 yrs
30-35 2,122,884 – 2.3 yrs
Outstanding options 15,076,954 57 4.6 yrs
USD-denominated
15-20 3,025,421 30 6.7 yrs
20-25 297,375 2 7.0 yrs
25-30 2,359,334 2 5.2 yrs
30-35 2,478,397 – 3.7 yrs
35-40 1,627,434 – 3.2 yrs
40-55 1,573,875 – 2.3 yrs
Outstanding options 11,361,836 34 4.6 yrs
The aggregate intrinsic value in the tables and text
above represents the total pre-tax intrinsic value (the
dierence between the Company’s closing share price
on the last trading day of 2014 and the exercise price,
multiplied by the number of in-the-money options)
that would have been received by the option holders if
the options had been exercised on December 31, 2014.
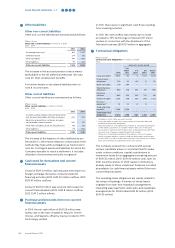
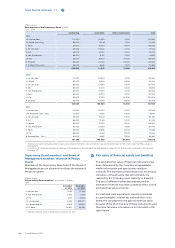
The following table summarizes information about the
Company’s Accelerate! options as of December 31, 2014
and changes during the year:
Philips Group
Accelerate! options
2014
options
weighted
average
exercise price
EUR-denominated
Outstanding at January 1, 2014 2,854,000 15.62
Exercised 1,048,117 15.24
Forfeited 37,083 15.24
Outstanding at December 31, 2014 1,768,800 15.86
Exercisable at December 31, 2014 1,616,800 15.24
USD-denominated
Outstanding at January 1, 2014 795,000 20.02
Exercised 336,200 20.02
Outstanding at December 31, 2014 458,800 20.02
Exercisable at December 31, 2014 458,800 20.02