Philips 2014 Annual Report Download - page 208
Download and view the complete annual report
Please find page 208 of the 2014 Philips annual report below. You can navigate through the pages in the report by either clicking on the pages listed below, or by using the keyword search tool below to find specific information within the annual report.-
 1
1 -
2
-
3
-
4
-
5
-
6
-
7
-
8
-
9
-
10
-
11
-
12
-
13
-
14
-
15
-
16
-
17
-
18
-
19
-
20
-
21
-
22
-
23
-
24
-
25
-
26
-
27
-
28
-
29
-
30
-
31
-
32
-
33
-
34
-
35
-
36
-
37
-
38
-
39
-
40
-
41
-
42
-
43
-
44
-
45
-
46
-
47
-
48
-
49
-
50
-
51
-
52
-
53
-
54
-
55
-
56
-
57
-
58
-
59
-
60
-
61
-
62
-
63
-
64
-
65
-
66
-
67
-
68
-
69
-
70
-
71
-
72
-
73
-
74
-
75
-
76
-
77
-
78
-
79
-
80
-
81
-
82
-
83
-
84
-
85
-
86
-
87
-
88
-
89
-
90
-
91
-
92
-
93
-
94
-
95
-
96
-
97
-
98
-
99
-
100
-
101
-
102
-
103
-
104
-
105
-
106
-
107
-
108
-
109
-
110
-
111
-
112
-
113
-
114
-
115
-
116
-
117
-
118
-
119
-
120
-
121
-
122
-
123
-
124
-
125
-
126
-
127
-
128
-
129
-
130
-
131
-
132
-
133
-
134
-
135
-
136
-
137
-
138
-
139
-
140
-
141
-
142
-
143
-
144
-
145
-
146
-
147
-
148
-
149
-
150
-
151
-
152
-
153
-
154
-
155
-
156
-
157
-
158
-
159
-
160
-
161
-
162
-
163
-
164
-
165
-
166
-
167
-
168
-
169
-
170
-
171
-
172
-
173
-
174
-
175
-
176
-
177
-
178
-
179
-
180
-
181
-
182
-
183
-
184
-
185
-
186
-
187
-
188
-
189
-
190
-
191
-
192
-
193
-
194
-
195
-
196
-
197
-
 198
198 -
 199
199 -
 200
200 -
 201
201 -
 202
202 -
 203
203 -
 204
204 -
 205
205 -
 206
206 -
 207
207 -
 208
208 -
 209
209 -
 210
210 -
 211
211 -
 212
212 -
 213
213 -
 214
214 -
 215
215 -
 216
216 -
 217
217 -
 218
218 -
219
-
220
-
221
-
222
-
223
-
224
-
225
-
226
-
227
-
228
-
229
-
230
-
231
-
232
-
233
-
234
-
235
-
236
-
237
-
238
-
239
-
240
-
241
-
242
-
243
-
244
 |
 |
Sustainability statements 14.3.1
208 Annual Report 2014
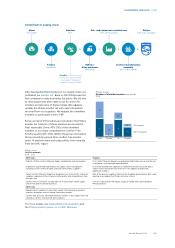
Improving people’s lives
At Philips, we strive to make the world healthier and
more sustainable through innovation. Our goal is to
improve the lives of 3 billion people a year by 2025.
Through Philips products and solutions that directly
support the curative or preventive side of people’s
health, we improved the lives of 670 million people in
2014, driven by our Healthcare sector. Additionally, our
well-being products that help people live a healthy life,
and our Green Products that contribute to a healthy
ecosystem, improved the lives of 290 million and 1.5
billion people respectively. After the elimination of
double counts - people touched multiple times - we
arrived at 1.9 billion lives. This is an increase of 200
million compared to in 2013.
Examples of products in the ‘well-being’ category that
help people live a healthier life are juicers, blenders, air
fryers, but also mother and childcare products.
Examples of Green Products, products oering a
signicant environmental improvement in one or more
Green Focal Areas, can be found in sub-section 5.3.2,
Green Product sales, of this Annual Report. Further
details on this parameter and the methodology can be
found in the document ‘Improving people’s lives’.
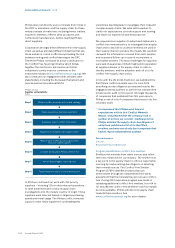
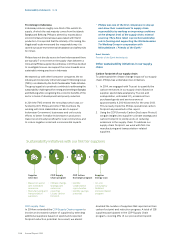
The circular economy program
The circular economy program in Philips has been
running for its second year in 2014 and consists of four
strategic pillars:
1. Connect to stakeholders outside Philips
2. Internal employee engagement
3. Create proof points and metrics
4. Embed circular economy in Philips processes
1. Philips takes advantage of the global partnership
with the Ellen MacArthur Foundation which
includes the CE100 events and education. But also
partnerships with Circle Economy Netherlands,
Turntoo, World Economic Forum and The Guardian
support Philips to take a leading position in driving
circular thinking. For example, the opening of the
Philips Healthcare Refurbishment factory was
followed by a panel discussion on circular economy
with Philips, IBM, Ricoh and the Ellen MacArthur
Foundation.
2. Through internal events, presentations, brochures,
internal communications, social media, etc. Philips’
employees are inspired and stimulated to start or
become involved in circular economy projects. For
example, during the Philips Innovation Experience
the circular economy framework was explained in
detail and demonstrated.
3. In many Philips business groups circular economy
projects have started. These are either linked to
customer access over ownership (pay for
performance), business model innovations (from
transactions to relationships via service and
solution models) or reverse cycles
(remanufacturing, refurbishment and parts
harvesting). To measure progress, a circular
economy scorecard has been developed. For
example, various Light-as-a-Service projects have
started in dierent areas of the world like in
Washington DC with lighting in parking garages of
the Washington Metropolitan Area Transit
Authority.
4. As the circular economy touches many dierent
business areas (strategy, design, business
development, marketing, nance, etc.) it is
important to have the right processes and
procedures developed and embedded throughout
the company. This is done as part of the
development of the Philips Excellence Process
Framework.
More information can be found on the
circular economy website.
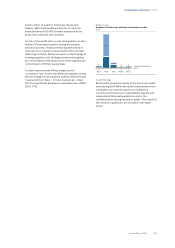
Operational carbon footprint and energy
eciency - 2014 details
Our operational carbon footprint in 2014 amounted to
1,375 kilotonnes CO2-equivalent, a reduction of 36%
compared to our 2007 baseline and close to our 40%
reduction target for 2015. The 2014 results can be
attributed to several factors:
• Accounting for 35% of the total footprint, total CO2
emissions from manufacturing decreased due to
operational changes and decreased energy usage,
due to lower load, with an increased share coming
from renewable sources. The decrease was in part
oset by new acquisitions reporting for the rst time.
• CO2 emissions from non-industrial operations
(oces, warehouses, etc.) represent 9% of the total.
The overall oor space in our real estate portfolio
increased by 2%. As a result, emissions increased
slightly compared to 2013. In 2015 we will continue to
focus on the most ecient use of facility space and
increase the share of purchased electricity from
renewable sources.
• The total CO2 emissions related to business travel,
accounting for 17% of our carbon footprint remained
stable compared to 2013. This is mainly attributable
to the success of our Green Lease Car policy, as
emissions from lease cars decreased by 7%. This
mitigated the increase of 5% in our air travel
emissions.
• Overall CO2 emissions from logistics, representing
39% of the total, decreased slightly by 1% compared
to 2013. We recorded an increase of emissions
coming from air and parcel freight. However, reduced
emissions from road and ocean freight resulted in a
downward change for logistics as a total. Due to
operational changes, data availability for our road
freight activities of Consumer Lifestyle and
Healthcare in the APAC region was limited. Therefore,