Philips 2014 Annual Report Download - page 23
Download and view the complete annual report
Please find page 23 of the 2014 Philips annual report below. You can navigate through the pages in the report by either clicking on the pages listed below, or by using the keyword search tool below to find specific information within the annual report.-
 1
1 -
2
-
3
-
4
-
5
-
6
-
7
-
8
-
9
-
10
-
11
-
12
-
 13
13 -
 14
14 -
 15
15 -
 16
16 -
 17
17 -
 18
18 -
 19
19 -
 20
20 -
 21
21 -
 22
22 -
 23
23 -
 24
24 -
 25
25 -
 26
26 -
 27
27 -
 28
28 -
 29
29 -
 30
30 -
 31
31 -
 32
32 -
 33
33 -
34
-
35
-
36
-
37
-
38
-
39
-
40
-
41
-
42
-
43
-
44
-
45
-
46
-
47
-
48
-
49
-
50
-
51
-
52
-
53
-
54
-
55
-
56
-
57
-
58
-
59
-
60
-
61
-
62
-
63
-
64
-
65
-
66
-
67
-
68
-
69
-
70
-
71
-
72
-
73
-
74
-
75
-
76
-
77
-
78
-
79
-
80
-
81
-
82
-
83
-
84
-
85
-
86
-
87
-
88
-
89
-
90
-
91
-
92
-
93
-
94
-
95
-
96
-
97
-
98
-
99
-
100
-
101
-
102
-
103
-
104
-
105
-
106
-
107
-
108
-
109
-
110
-
111
-
112
-
113
-
114
-
115
-
116
-
117
-
118
-
119
-
120
-
121
-
122
-
123
-
124
-
125
-
126
-
127
-
128
-
129
-
130
-
131
-
132
-
133
-
134
-
135
-
136
-
137
-
138
-
139
-
140
-
141
-
142
-
143
-
144
-
145
-
146
-
147
-
148
-
149
-
150
-
151
-
152
-
153
-
154
-
155
-
156
-
157
-
158
-
159
-
160
-
161
-
162
-
163
-
164
-
165
-
166
-
167
-
168
-
169
-
170
-
171
-
172
-
173
-
174
-
175
-
176
-
177
-
178
-
179
-
180
-
181
-
182
-
183
-
184
-
185
-
186
-
187
-
188
-
189
-
190
-
191
-
192
-
193
-
194
-
195
-
196
-
197
-
198
-
199
-
200
-
201
-
202
-
203
-
204
-
205
-
206
-
207
-
208
-
209
-
210
-
211
-
212
-
213
-
214
-
215
-
216
-
217
-
218
-
219
-
220
-
221
-
222
-
223
-
224
-
225
-
226
-
227
-
228
-
229
-
230
-
231
-
232
-
233
-
234
-
235
-
236
-
237
-
238
-
239
-
240
-
241
-
242
-
243
-
244
 |
 |

Group performance 5.1.2
Annual Report 2014 23
geographies, largely due to Western Europe and North
America. Growth geographies recorded a mid-single-
digit decline, mainly driven by China.
IG&S reported sales of EUR 605 million, which was EUR
60 million lower than in 2013, mainly due to lower
royalty income.
5.1.2 Earnings
In 2014, Philips’ gross margin was EUR 8,206 million, or
38.4% of sales, compared to EUR 9,337 million, or 42.5%
of sales, in 2013. Gross margin in 2014 included EUR 249
million of restructuring and acquisition-related charges,
whereas 2013 included EUR 48 million of restructuring
and acquisition-related charges. 2014 also included
charges of EUR 366 million related to the jury verdict in
the Masimo litigation, EUR 68 million of impairment and
other charges, and EUR 49 million of mainly inventory
write-downs related to the voluntary suspension of
production at the Cleveland facility. Excluding these
items, the year-on-year decline was mainly driven by
operational decline at Healthcare and Lighting as well
as negative currency impacts.
Selling expenses increased from EUR 5,057 million in
2013 to EUR 5,124 million in 2014. 2014 included EUR 128
million of restructuring and acquisition-related charges,
compared to EUR 45 million of restructuring charges in
2013. The year-on-year increase was mainly
attributable to higher restructuring activities. Selling
expenses increased from 23.0% of sales to 24.0%.
General and administrative expenses amounted to EUR
747 million in 2014, compared to EUR 825 million in
2013. As a percentage of sales, costs decreased from
3.8% in 2013 to 3.5% in 2014. 2014 included EUR 23
million of restructuring and acquisition related-charges,
compared to EUR 5 million in 2013. 2014 also included
a EUR 67 million past-service pension gain in the
Netherlands, while 2013 included a pension settlement
loss of EUR 31 million.
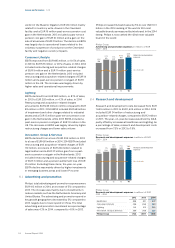
Research and development costs decreased from EUR
1,659 million in 2013 to EUR 1,635 million in 2014.
Research and development costs in 2014 included EUR
34 million of restructuring and acquisition-related
charges, compared to EUR 2 million in 2013. The year-
on-year decrease was mainly due to lower spend at
IG&S, partly oset by higher restructuring costs in all
sectors. As a percentage of sales, research and
development costs increased from 7.5% in 2013 to 7.6%
in 2014.
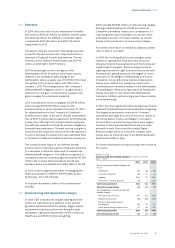
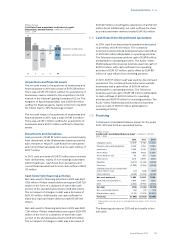
The overview below shows sales, EBIT and EBITA
according to the 2014 sector classications.
Philips Group
Sales, EBIT and EBITA
in millions of EUR unless otherwise stated
2013 - 2014
Sales EBIT % EBITA1) %
2014
Healthcare 9,186 456 5.0% 616 6.7%
Consumer
Lifestyle 4,731 520 11.0% 573 12.1%
Lighting 6,869 185 2.7% 293 4.3%
Innovation,
Group & Services 605 (675)
−
(661)
−
Philips Group 21,391 486 2.3% 821 3.8%
2013
Healthcare 9,575 1,315 13.7% 1,512 15.8%
Consumer
Lifestyle 4,605 429 9.3% 483 10.5%
Lighting 7,145 413 5.8% 580 8.1%
Innovation,
Group & Services 665 (302)
−
(299)
−
Philips Group 21,990 1,855 8.4% 2,276 10.4%
1) For a reconciliation to the most directly comparable GAAP measures,
see chapter 15, Reconciliation of non-GAAP information, of this Annual
Report
In 2014, EBIT decreased by EUR 1,369 million year-on-
year to EUR 486 million, or 2.3% of sales. 2014 included
EUR 434 million of restructuring and acquisition-
related charges, compared to EUR 100 million in 2013.
2014 included EUR 366 million related to the jury verdict
in the Masimo litigation, EUR 49 million mainly related
to inventory write-downs in the Cleveland facility,
charges of EUR 244 million related to legal matters, EUR
68 million of impairment and other charges related to
industrial assets at Lighting, and a EUR 67 million past-
service pension cost gain in the Netherlands. 2013 EBIT
was also impacted by a net gain of EUR 47 million from
a past-service pension cost gain and related settlement
loss in the US, as well as a EUR 21 million gain on the
sale of a business in Healthcare.
Amortization and impairment of intangibles, excluding
software and capitalized product development costs,
amounted to EUR 332 million in 2014, compared to EUR
393 million in 2013. In 2014, goodwill impairment
charges amount to EUR 3 million consisting of
impairments on divested businesses in Healthcare and
Lighting. In 2013, goodwill impairment charges
amounted to EUR 28 million, including EUR 26 million
as a result of reduced growth expectations in Consumer
Luminaires, see note 11, Goodwill.
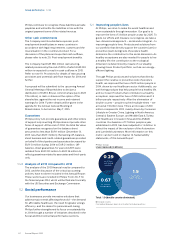
EBITA declined from EUR 2,276 million, or 10.4% of
sales, in 2013 to EUR 821 million, or 3.8% of sales, in
2014. EBITA showed a year-on-year decrease at all
sectors except Consumer Lifestyle.
Healthcare
EBITA decreased from EUR 1,512 million, or 15.8% of
sales, in 2013 to EUR 616 million, or 6.7% of sales, in
2014. Restructuring and acquisition-related charges in
2013 were close to zero, compared to EUR 70 million in
2014. 2014 included EUR 366 million related to the jury