Philips 2014 Annual Report Download - page 135
Download and view the complete annual report
Please find page 135 of the 2014 Philips annual report below. You can navigate through the pages in the report by either clicking on the pages listed below, or by using the keyword search tool below to find specific information within the annual report.-
 1
1 -
2
-
3
-
4
-
5
-
6
-
7
-
8
-
9
-
10
-
11
-
12
-
13
-
14
-
15
-
16
-
17
-
18
-
19
-
20
-
21
-
22
-
23
-
24
-
25
-
26
-
27
-
28
-
29
-
30
-
31
-
32
-
33
-
34
-
35
-
36
-
37
-
38
-
39
-
40
-
41
-
42
-
43
-
44
-
45
-
46
-
47
-
48
-
49
-
50
-
51
-
52
-
53
-
54
-
55
-
56
-
57
-
58
-
59
-
60
-
61
-
62
-
63
-
64
-
65
-
66
-
67
-
68
-
69
-
70
-
71
-
72
-
73
-
74
-
75
-
76
-
77
-
78
-
79
-
80
-
81
-
82
-
83
-
84
-
85
-
86
-
87
-
88
-
89
-
90
-
91
-
92
-
93
-
94
-
95
-
96
-
97
-
98
-
99
-
100
-
101
-
102
-
103
-
104
-
105
-
106
-
107
-
108
-
109
-
110
-
111
-
112
-
113
-
114
-
115
-
116
-
117
-
118
-
119
-
120
-
121
-
122
-
123
-
124
-
 125
125 -
 126
126 -
 127
127 -
 128
128 -
 129
129 -
 130
130 -
 131
131 -
 132
132 -
 133
133 -
 134
134 -
 135
135 -
 136
136 -
 137
137 -
 138
138 -
 139
139 -
 140
140 -
 141
141 -
 142
142 -
 143
143 -
 144
144 -
 145
145 -
146
-
147
-
148
-
149
-
150
-
151
-
152
-
153
-
154
-
155
-
156
-
157
-
158
-
159
-
160
-
161
-
162
-
163
-
164
-
165
-
166
-
167
-
168
-
169
-
170
-
171
-
172
-
173
-
174
-
175
-
176
-
177
-
178
-
179
-
180
-
181
-
182
-
183
-
184
-
185
-
186
-
187
-
188
-
189
-
190
-
191
-
192
-
193
-
194
-
195
-
196
-
197
-
198
-
199
-
200
-
201
-
202
-
203
-
204
-
205
-
206
-
207
-
208
-
209
-
210
-
211
-
212
-
213
-
214
-
215
-
216
-
217
-
218
-
219
-
220
-
221
-
222
-
223
-
224
-
225
-
226
-
227
-
228
-
229
-
230
-
231
-
232
-
233
-
234
-
235
-
236
-
237
-
238
-
239
-
240
-
241
-
242
-
243
-
244
 |
 |

8Group nancial statements 12.9
Annual Report 2014 135
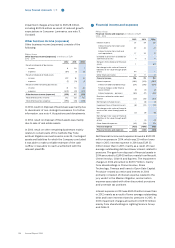
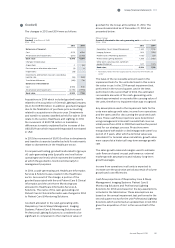
Net nancial income and expense showed a EUR 329
million expense in 2012. Total nancial income of EUR
106 million included a EUR 46 million gain related to a
change in estimate on the valuation of long term
derivative contracts.
8Income taxes
The tax expense on income before tax of continuing
operations amounted to EUR 26 million (2013: EUR 466
million, 2012: EUR 218 million).
The components of income before taxes and income
tax expense are as follows:
Philips Group
Income tax expense in millions of EUR
2012 - 2014
2012 2013 2014
Netherlands (186) 281 665
Foreign 449 1,244 (480)
Income before taxes of continuing
operations 263 1,525 185
Netherlands:
Current tax income (expense) (74) – 17
Deferred tax income (expense) 13 (107) (29)
Total tax expense (Netherlands) (61) (107) (12)
Foreign:
Current tax expense (283) (280) (275)
Deferred tax income (expense) 143 (89) 250
Total tax expense (foreign) (140) (369) (25)
Income tax expense of continuing
operations (218) (466) (26)
Income tax expense of discontinued
operations 17 (10) (11)
Income tax expense (201) (476) (37)
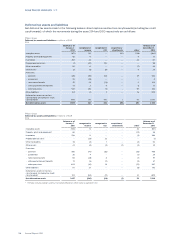
The components of income tax expense are as follows:
Philips Group
Current income tax expense in millions of EUR
2012 - 2014
2012 2013 2014
Current tax expense (369) (268) (281)
Prior year results 12 (12) 23
Current tax expense (357) (280) (258)
Philips Group
Deferred income tax expense in millions of EUR
2012 - 2014
2012 2013 2014
Recognition of previously
unrecognized tax losses 1 20 18
Current year tax loss carried
forwards not recognized (50) (29) (65)
Temporary dierences (not
recognized) recognized 2 (3) (47)
Prior year results (2) 15 34
Tax rate changes (4) – 12
Origination and reversal of
temporary dierences 209 (199) 269
Deferred tax income (expense) 156 (196) 221
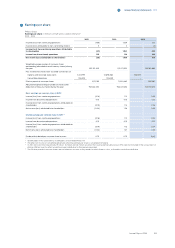
Philips’ operations are subject to income taxes in
various foreign jurisdictions. The statutory income tax
rates vary from 10.0% to 39.4%, which results in a
dierence between the weighted average statutory
income tax rate and the Netherlands’ statutory income
tax rate of 25.0% (2013: 25.0%; 2012: 25.0%).
A reconciliation of the weighted average statutory
income tax rate to the eective income tax rate of
continuing operations is as follows:
Philips Group
Eective tax rate in %
2012 - 2014
2012 2013 2014
Weighted average statutory income
tax rate in % 30.0 29.2 7.9
Tax rate eect of:
Changes related to:
- utilization of previously reserved
loss carryforwards (0.2) (1.3) (9.6)
- new loss carryforwards not
expected to be realized 19.1 1.9 34.9
- addition (releases) of temporary
dierences not expected to be
realized (0.7) 0.2 25.5
Non-tax-deductible impairment
charges 0.8 0.7 1.8
Non-taxable income (22.7) (8.9) (100.1)
Non-tax-deductible expenses 83.3 8.1 51.6
Withholding and other taxes 8.3 0.9 13.4
Tax rate changes 1.4 0.0 (6.3)
Prior year tax results (3.7) (0.2) (30.8)
Tax expenses due to other liabilities 8.2 0.3 5.6
Tax incentives and other (40.9) (0.3) 20.2
Eective tax rate 82.9 30.6 14.1
The weighted average statutory income tax rate
decreased in 2014 compared to 2013, as a consequence
of a signicant change in the mix of prots and losses
in the various countries.
The eective income tax rate is higher than the
weighted average statutory income tax rate in 2014,
mainly due to the non-deductible expenses, new loss
carryforwards and temporary dierences not expected
to be realized which are partly oset by non-taxable
income. Non-taxable income is predominantly
attributable to favorable tax regulations relating to R&D
investments.