Philips 2014 Annual Report Download - page 39
Download and view the complete annual report
Please find page 39 of the 2014 Philips annual report below. You can navigate through the pages in the report by either clicking on the pages listed below, or by using the keyword search tool below to find specific information within the annual report.-
 1
1 -
2
-
3
-
4
-
5
-
6
-
7
-
8
-
9
-
10
-
11
-
12
-
13
-
14
-
15
-
16
-
17
-
18
-
19
-
20
-
21
-
22
-
23
-
24
-
25
-
26
-
27
-
28
-
 29
29 -
 30
30 -
 31
31 -
 32
32 -
 33
33 -
 34
34 -
 35
35 -
 36
36 -
 37
37 -
 38
38 -
 39
39 -
 40
40 -
 41
41 -
 42
42 -
 43
43 -
 44
44 -
 45
45 -
 46
46 -
 47
47 -
 48
48 -
 49
49 -
50
-
51
-
52
-
53
-
54
-
55
-
56
-
57
-
58
-
59
-
60
-
61
-
62
-
63
-
64
-
65
-
66
-
67
-
68
-
69
-
70
-
71
-
72
-
73
-
74
-
75
-
76
-
77
-
78
-
79
-
80
-
81
-
82
-
83
-
84
-
85
-
86
-
87
-
88
-
89
-
90
-
91
-
92
-
93
-
94
-
95
-
96
-
97
-
98
-
99
-
100
-
101
-
102
-
103
-
104
-
105
-
106
-
107
-
108
-
109
-
110
-
111
-
112
-
113
-
114
-
115
-
116
-
117
-
118
-
119
-
120
-
121
-
122
-
123
-
124
-
125
-
126
-
127
-
128
-
129
-
130
-
131
-
132
-
133
-
134
-
135
-
136
-
137
-
138
-
139
-
140
-
141
-
142
-
143
-
144
-
145
-
146
-
147
-
148
-
149
-
150
-
151
-
152
-
153
-
154
-
155
-
156
-
157
-
158
-
159
-
160
-
161
-
162
-
163
-
164
-
165
-
166
-
167
-
168
-
169
-
170
-
171
-
172
-
173
-
174
-
175
-
176
-
177
-
178
-
179
-
180
-
181
-
182
-
183
-
184
-
185
-
186
-
187
-
188
-
189
-
190
-
191
-
192
-
193
-
194
-
195
-
196
-
197
-
198
-
199
-
200
-
201
-
202
-
203
-
204
-
205
-
206
-
207
-
208
-
209
-
210
-
211
-
212
-
213
-
214
-
215
-
216
-
217
-
218
-
219
-
220
-
221
-
222
-
223
-
224
-
225
-
226
-
227
-
228
-
229
-
230
-
231
-
232
-
233
-
234
-
235
-
236
-
237
-
238
-
239
-
240
-
241
-
242
-
243
-
244
 |
 |
Group performance 5.3.1
Annual Report 2014 39
all Green Focal Areas and aim to reduce environmental
impact over the total lifecycle, with a focus on energy
eciency and substance management. Other areas
covered include increased levels of recycled content in
our products, remote servicing and closing the
materials loop contributing to a circular economy, e.g.
through upgrading strategies, parts harvesting and
refurbishing. Healthcare actively supports a voluntary
industry initiative (COCIR) for improving the energy
eciency of imaging equipment. Moreover, we are
actively partnering with care providers to look together
for innovative ways to reduce the environmental impact
of healthcare, for example by optimizing energy
ecient use of medical equipment.
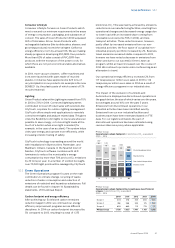
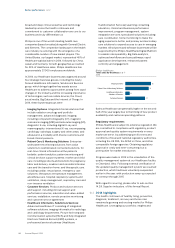
Consumer Lifestyle
Increased R&D investments at Consumer Lifestyle are
also reected in increased Green Innovation which
amounted to EUR 97 million in 2014 compared to EUR
75 million in 2013. This increase resulted in higher Green
Product sales in all Business Groups. The sector
continued its work on improving the energy eciency
of its products, closing the materials loop (e.g. by using
recycled materials in products and packaging) and the
voluntary phase-out of polyvinyl chloride (PVC),
brominated ame retardants (BFR) and Bisphenol A
(BPA) from food contact products. In particular, more
than 80% of the shaving, grooming and oral healthcare
products are completely PVC/BFR-free.
Lighting
At Lighting, we strive to make the world healthier and
more sustainable through energy-ecient lighting
systems. With a 2014 investment of EUR 255 million in
Green Innovation (excluding Lumileds and Automotive
at EUR 105 million), Lighting invested EUR 32 million
more than in 2013. Increasing investments in digital
lighting solutions have led to further improvements in
the area of energy eciency. In 2014, Lighting piloted a
breakthrough connected lighting system for oces,
featuring Power-over-Ethernet (PoE-enabled)
luminaires. By oering employees personal control of
the lighting above their desks, the system delivers
appropriate task lighting levels while keeping general
lighting levels lower, enhancing both worker eciency
and energy eciency. The connected lighting system
integrates with other building systems such as heating,
ventilation, and IT services to realize signicant energy
savings — not only on lighting, but also on HVAC and
other services, which together account for up to 70% of
a building’s energy usage.
Beyond signicant energy eciency benets, the
connected lighting system supports the transition to a
more circular economy. PoE-enabled luminaires
eliminate the need for power cabling, simplifying
installation and lowering initial costs. A exible and
open system architecture streamlines servicing and
maintenance, aords an easy upgrade path, and
extends system lifetime.
Philips Group Innovation
Philips Group Innovation invested EUR 21 million in
Green Innovations, spread over projects focused on
global challenges related to water, air, waste, energy,
food and access to aordable healthcare. Group
Innovation used the Sustainable Innovations
Assessment tool, in which innovation projects are
mapped, categorized and scored along the
environmental and social dimension in order to identify
those innovation projects that drive sustainable
innovation.
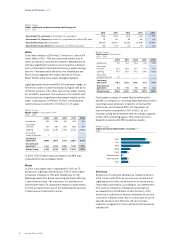
Philips Green Patent portfolio
At the end of 2014, Philips’ IP portfolio comprised 8%
green patent families, which means that all these
patent families were labeled with at least one Green
Focal Area. In 2014, 10% of our total patent lings were
agged as green patent family. Energy eciency is the
most frequently occurring Green Focal Area throughout
the portfolio. Multiplying the portfolio percentage with
our annual patent portfolio cost in 2014 determines the
amount that we invest in Green IP, which constitutes
part of Philips investment in Green Innovation.
While a product can become green by incorporating an
environmentally friendly technology, such technology
cannot necessarily be protected in a patent because of
lack of patentability over the state-of-the-art
technology. Therefore not all Green Technologies
implemented in our Green Products can be captured in
patents.
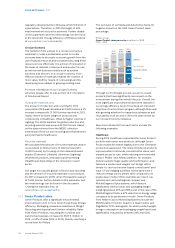
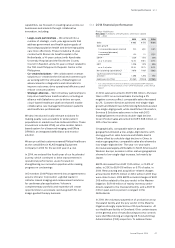
Energy eciency of products
Energy eciency is a key Green Focal Area for our
Green Products. According to our analysis, about 97%
of the energy consumed during the use phase of our
products is attributable to Lighting products. The
remaining 3% is split over Consumer Lifestyle and
Healthcare. Therefore, we focus on the energy
eciency of our Lighting products in the calculation.
The annual energy consumption per product category
is calculated by multiplying the power consumption of
a product by the average annual operating hours and
the annual pieces sold and then dividing the light
output (lumens) by the energy consumed (watts). The
average energy eciency of our total product portfolio
increased slightly in 2014 to 40.5 lumen per watt (but
improved 21% compared to 2009, the baseline year).
The exclusion of Lumileds and Automotive has a limited
upward eect on the energy eciency of the portfolio.
In 2014 LED sales advanced well, but demand for
conventional lighting remained fairly stable due to the
challenging economic environment. Since the number
of traditional lamps sold is signicantly higher than
LEDs, the energy eciency improvement of the total
Lighting portfolio in 2014 was limited. We expect the
energy eciency to improve in the coming years as the
traditional incandescent lamp is banned in more
countries. Our target for 2015 is a 50% improvement
compared to the 2009 baseline. In this target setting,
assumptions were made about the speed of the