Philips 2014 Annual Report Download - page 40
Download and view the complete annual report
Please find page 40 of the 2014 Philips annual report below. You can navigate through the pages in the report by either clicking on the pages listed below, or by using the keyword search tool below to find specific information within the annual report.-
 1
1 -
2
-
3
-
4
-
5
-
6
-
7
-
8
-
9
-
10
-
11
-
12
-
13
-
14
-
15
-
16
-
17
-
18
-
19
-
20
-
21
-
22
-
23
-
24
-
25
-
26
-
27
-
28
-
29
-
 30
30 -
 31
31 -
 32
32 -
 33
33 -
 34
34 -
 35
35 -
 36
36 -
 37
37 -
 38
38 -
 39
39 -
 40
40 -
 41
41 -
 42
42 -
 43
43 -
 44
44 -
 45
45 -
 46
46 -
 47
47 -
 48
48 -
 49
49 -
 50
50 -
51
-
52
-
53
-
54
-
55
-
56
-
57
-
58
-
59
-
60
-
61
-
62
-
63
-
64
-
65
-
66
-
67
-
68
-
69
-
70
-
71
-
72
-
73
-
74
-
75
-
76
-
77
-
78
-
79
-
80
-
81
-
82
-
83
-
84
-
85
-
86
-
87
-
88
-
89
-
90
-
91
-
92
-
93
-
94
-
95
-
96
-
97
-
98
-
99
-
100
-
101
-
102
-
103
-
104
-
105
-
106
-
107
-
108
-
109
-
110
-
111
-
112
-
113
-
114
-
115
-
116
-
117
-
118
-
119
-
120
-
121
-
122
-
123
-
124
-
125
-
126
-
127
-
128
-
129
-
130
-
131
-
132
-
133
-
134
-
135
-
136
-
137
-
138
-
139
-
140
-
141
-
142
-
143
-
144
-
145
-
146
-
147
-
148
-
149
-
150
-
151
-
152
-
153
-
154
-
155
-
156
-
157
-
158
-
159
-
160
-
161
-
162
-
163
-
164
-
165
-
166
-
167
-
168
-
169
-
170
-
171
-
172
-
173
-
174
-
175
-
176
-
177
-
178
-
179
-
180
-
181
-
182
-
183
-
184
-
185
-
186
-
187
-
188
-
189
-
190
-
191
-
192
-
193
-
194
-
195
-
196
-
197
-
198
-
199
-
200
-
201
-
202
-
203
-
204
-
205
-
206
-
207
-
208
-
209
-
210
-
211
-
212
-
213
-
214
-
215
-
216
-
217
-
218
-
219
-
220
-
221
-
222
-
223
-
224
-
225
-
226
-
227
-
228
-
229
-
230
-
231
-
232
-
233
-
234
-
235
-
236
-
237
-
238
-
239
-
240
-
241
-
242
-
243
-
244
 |
 |

Group performance 5.3.1
40 Annual Report 2014
regulatory developments in this area, which fell short of
expectations. Therefore, in 2015 the target of 50%
improvement will not yet be achieved. Further details
on this parameter and the methodology can be found
in the document ‘Energy eciency of Philips products’
at www.philips.com/sustainability.
Circular Economy
The transition from a linear to a circular economy is
essential to create a sustainable world. A circular
economy aims to decouple economic growth from the
use of natural resources and ecosystems by using these
resources more eectively. It is a driver of innovation in
the areas of material, component and product re-use,
as well as new business models such as system
solutions and services. In a circular economy, more
eective (re)use of materials enables the creation of
more value, both by means of cost savings and by
developing new markets or growing existing ones.
For more information on our Circular Economy
activities, please refer to sub-section 14.3.1, EcoVision,
of this Annual Report.
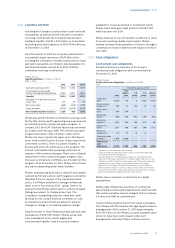
Closing the materials loop
The amount of collection and recycling for 2013
(reported in 2014) was calculated at 31,500 tonnes, a 3%
increase compared to 31,000 tonnes reported in 2013,
mainly driven by lower weight of products and
components in Healthcare, oset by higher volumes in
Lighting. The 2009 baseline for global collection and
recycling amounts was around 22,500 tonnes, based
on the data retrieved from the WEEE collection
schemes and from our own recycling and refurbishment
services (mainly Healthcare).
Recycled materials
We calculated the amount of recycled materials used in
our products in 2014 at some 13,000 tonnes (2013:
14,000 tonnes), by focusing on the material streams
plastics (Consumer Lifestyle), aluminum (Lighting),
refurbished products, and spare parts harvesting
(Healthcare) depending on the relevance in each
sector.
Our target is to double global collection and recycling
and the amount of recycled materials in our products
by 2015 compared to 2009, when the baseline was set
at 7,500 tonnes. Further details on this parameter and
the methodology can be found in the document
‘Closing the materials loop’ at
www.philips.com/sustainability.
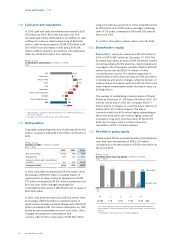
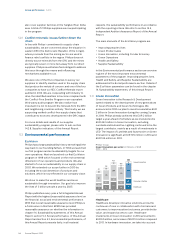
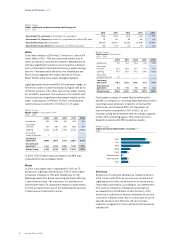
5.3.2 Green Product sales
Green Products oer a signicant environmental
improvement in one or more Green Focal Areas: Energy
eciency, Packaging, Hazardous substances, Weight,
Recycling and disposal and Lifetime reliability. Sales
from Green Products, excluding the Lumileds and
Automotive business, increased to EUR 11.1 billion in
2014, or 52% of sales (50% in 2013), thereby reaching a
record level for Philips.
The exclusion of Lumileds and Automotive had a 1%
negative impact on the total Green Product sales
percentage.
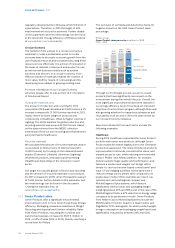
Philips Group
Green Product sales per sector in millions of EUR
2010 - 2014
2,136
1,067
3,696
6,899
35.8%
‘10
2,663
1,101
3,955
7,719
38.8%
‘11
3,610
1,619
5,056
10,285
46.3%
‘12
3,690
2,270
5,037
10,997
50.0%
‘13
3,508 Healthcare
2,605 Consumer Lifestyle
4,952 Lighting
11,065
51.7%
‘14
As a % of sales
Through our EcoDesign process, we aim to create
products that have signicantly less impact on the
environment during their whole lifecycle. Overall, the
most signicant improvements have been realized in
our energy eciency Green Focal Area, an important
objective of our EcoVision program, although there was
also growing attention for hazardous substances and
recyclability in all sectors in 2014, the latter driven by
our Circular Economy initiatives.
New Green Products from each sector include the
following examples.
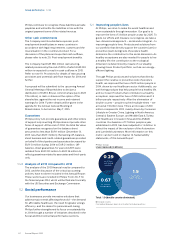
Healthcare
During 2014, Healthcare expanded the Green Product
portfolio with seven new products, although Green
Product sales decreased slightly due to the Cleveland
production suspension. The newly introduced products
improve patient outcomes, provide better value, and
expand access to care, while reducing environmental
impact. Philips’ new Anity platform, for example,
delivers superb image quality and performance, and
features a modern and elegant cart design with a
simple-to-use touchscreen-based control panel, and
ease-of-use imaging workow. At the same time it
reduces energy use by almost 40% compared to its
predecessor model. Other examples are new X-ray
systems such as DuraDiagnost compact and
MobileDiagnost Opta systems, which feature
signicantly lower product and packaging weight
(ranging between 20% and 38%), and, in the case of the
MobileDiagnost Opta, a 67% reduction in energy usage
compared to its predecessor model. Green Products
from Patient Care & Monitoring Systems include the
MX550 patient monitor, Avalon CL fetal monitor and
PageWriter TC10 cardiograph, for which product weight,
energy consumption and packaging weight have been
signicantly reduced (by between 24% and 62%).