Philips 2014 Annual Report Download - page 59
Download and view the complete annual report
Please find page 59 of the 2014 Philips annual report below. You can navigate through the pages in the report by either clicking on the pages listed below, or by using the keyword search tool below to find specific information within the annual report.-
 1
1 -
2
-
3
-
4
-
5
-
6
-
7
-
8
-
9
-
10
-
11
-
12
-
13
-
14
-
15
-
16
-
17
-
18
-
19
-
20
-
21
-
22
-
23
-
24
-
25
-
26
-
27
-
28
-
29
-
30
-
31
-
32
-
33
-
34
-
35
-
36
-
37
-
38
-
39
-
40
-
41
-
42
-
43
-
44
-
45
-
46
-
47
-
48
-
 49
49 -
 50
50 -
 51
51 -
 52
52 -
 53
53 -
 54
54 -
 55
55 -
 56
56 -
 57
57 -
 58
58 -
 59
59 -
 60
60 -
 61
61 -
 62
62 -
 63
63 -
 64
64 -
 65
65 -
 66
66 -
 67
67 -
 68
68 -
 69
69 -
70
-
71
-
72
-
73
-
74
-
75
-
76
-
77
-
78
-
79
-
80
-
81
-
82
-
83
-
84
-
85
-
86
-
87
-
88
-
89
-
90
-
91
-
92
-
93
-
94
-
95
-
96
-
97
-
98
-
99
-
100
-
101
-
102
-
103
-
104
-
105
-
106
-
107
-
108
-
109
-
110
-
111
-
112
-
113
-
114
-
115
-
116
-
117
-
118
-
119
-
120
-
121
-
122
-
123
-
124
-
125
-
126
-
127
-
128
-
129
-
130
-
131
-
132
-
133
-
134
-
135
-
136
-
137
-
138
-
139
-
140
-
141
-
142
-
143
-
144
-
145
-
146
-
147
-
148
-
149
-
150
-
151
-
152
-
153
-
154
-
155
-
156
-
157
-
158
-
159
-
160
-
161
-
162
-
163
-
164
-
165
-
166
-
167
-
168
-
169
-
170
-
171
-
172
-
173
-
174
-
175
-
176
-
177
-
178
-
179
-
180
-
181
-
182
-
183
-
184
-
185
-
186
-
187
-
188
-
189
-
190
-
191
-
192
-
193
-
194
-
195
-
196
-
197
-
198
-
199
-
200
-
201
-
202
-
203
-
204
-
205
-
206
-
207
-
208
-
209
-
210
-
211
-
212
-
213
-
214
-
215
-
216
-
217
-
218
-
219
-
220
-
221
-
222
-
223
-
224
-
225
-
226
-
227
-
228
-
229
-
230
-
231
-
232
-
233
-
234
-
235
-
236
-
237
-
238
-
239
-
240
-
241
-
242
-
243
-
244
 |
 |

Sector performance 6.3.4
Annual Report 2014 59
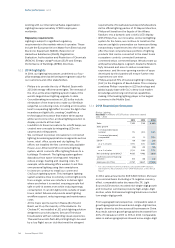
decline, with Western Europe and North America
recording a low-single-digit decline and other mature
geographies registering a mid-single-digit decline.
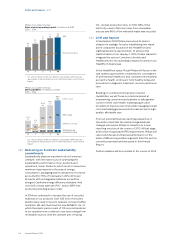
Sales of LED-based products grew to 34% of total sales,
up from 25% in 2013, driven by Light Sources &
Electronics and Professional Lighting Solutions. Sales
of energy-ecient Green Products exceeded EUR
4,952 million, or 72% of sector sales.
EBITA declined from EUR 580 million, or 8.1% of sales,
in 2013 to EUR 293 million, or 4.3% of sales in 2014.
Restructuring and acquisition-related charges
amounted to EUR 245 million in 2014, compared to EUR
83 million in 2013. 2014 also included a EUR 13 million
past-service pension cost gain in the Netherlands and
EUR 68 million of impairment and other charges related
to industrial assets, while 2013 included a EUR 10 million
past-service pension cost gain. The decrease in EBITA
was mainly attributable to higher restructuring and
acquisition-related charges and lower sales volume.
EBIT amounted to EUR 185 million, or 2.7% of sales,
which included EUR 106 million of amortization
charges, mainly related to intangible assets at
Professional Lighting Solutions.
Net operating capital decreased by EUR 824 million to
EUR 3.6 billion. The decrease was mainly due to the
reclassication of Lumileds and Automotive as assets
held for sale in 2014, partly oset by positive currency
impacts.
Cash ows before nancing activities increased from
EUR 418 million in 2013 to EUR 442 million, as lower
earnings were partly oset by a reduction in working
capital.
Philips Lighting
Sales per geographic cluster in millions of EUR
2010 - 2014
2,109
1,848
226
2,281
6,464
‘10
2,060
1,832
224
2,492
6,608
‘11
2,225
1,991
234
2,853
7,303
‘12
2,214
1,827
213
2,891
7,145
‘13
2,205 Western Europe
1,779 North America
198
Other mature
2,687 Growth
6,869
‘14
Philips Lighting
Sales and net operating capital1) in billions of EUR
2010 - 2014
6.5
‘10
5.5
6.6
‘11
5.0 7.3
‘12
4.6
7.1
‘13
4.5
6.9 Sales
‘14
3.6
Net operating capital
1) For a reconciliation to the most directly comparable GAAP measures,
see chapter 15, Reconciliation of non-GAAP information, of this Annual
Report
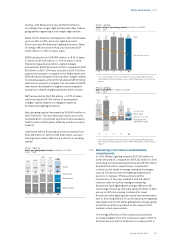
Philips Lighting
EBIT and EBITA1) in millions of EUR
2010 - 2014
115
528
643
9.9%
‘10
769
(439)
330
5.0%
‘11
147
(78)
69
0.9%
‘12
167
413
580
8.1%
‘13
108 Amortization and
impairment in value
185 EBIT in value
293 EBITA in value
4.3%
‘14
EBITA as a % of sales
1) For a reconciliation to the most directly comparable GAAP measures,
see chapter 15, Reconciliation of non-GAAP information, of this Annual
Report
6.3.5 Delivering on EcoVision sustainability
commitments
In 2014, Philips Lighting invested EUR 255 million in
Green Innovation, compared to EUR 223 million in 2013
(excluding Lumileds and Automotive at EUR 105 million
and EUR 104 million respectively). Investments
continue to be made in energy-saving technologies
such as LED and connected lighting systems and
services. In January, Philips announced the
introduction of the new InstantFit LED T8, which
reduces costs for facility managers replacing
uorescent tube lighting with energy-ecient LED
technology, known as LED tube lamps (TLEDs). TLEDs
use up to 40% less energy compared to linear
uorescent tube lighting and require less maintenance
due to their long lifetime. If current uorescent lighting
was replaced by TLED lamps globally the energy saving
potential would be equivalent to the output of 210
medium-sized power plants.
The energy eciency of the total product portfolio
increased slightly from 40.1 lumens per watt in 2013 to
40.5 lumens per watt in 2014 due to a volume shift in