Philips 2014 Annual Report Download - page 192
Download and view the complete annual report
Please find page 192 of the 2014 Philips annual report below. You can navigate through the pages in the report by either clicking on the pages listed below, or by using the keyword search tool below to find specific information within the annual report.-
 1
1 -
2
-
3
-
4
-
5
-
6
-
7
-
8
-
9
-
10
-
11
-
12
-
13
-
14
-
15
-
16
-
17
-
18
-
19
-
20
-
21
-
22
-
23
-
24
-
25
-
26
-
27
-
28
-
29
-
30
-
31
-
32
-
33
-
34
-
35
-
36
-
37
-
38
-
39
-
40
-
41
-
42
-
43
-
44
-
45
-
46
-
47
-
48
-
49
-
50
-
51
-
52
-
53
-
54
-
55
-
56
-
57
-
58
-
59
-
60
-
61
-
62
-
63
-
64
-
65
-
66
-
67
-
68
-
69
-
70
-
71
-
72
-
73
-
74
-
75
-
76
-
77
-
78
-
79
-
80
-
81
-
82
-
83
-
84
-
85
-
86
-
87
-
88
-
89
-
90
-
91
-
92
-
93
-
94
-
95
-
96
-
97
-
98
-
99
-
100
-
101
-
102
-
103
-
104
-
105
-
106
-
107
-
108
-
109
-
110
-
111
-
112
-
113
-
114
-
115
-
116
-
117
-
118
-
119
-
120
-
121
-
122
-
123
-
124
-
125
-
126
-
127
-
128
-
129
-
130
-
131
-
132
-
133
-
134
-
135
-
136
-
137
-
138
-
139
-
140
-
141
-
142
-
143
-
144
-
145
-
146
-
147
-
148
-
149
-
150
-
151
-
152
-
153
-
154
-
155
-
156
-
157
-
158
-
159
-
160
-
161
-
162
-
163
-
164
-
165
-
166
-
167
-
168
-
169
-
170
-
171
-
172
-
173
-
174
-
175
-
176
-
177
-
178
-
179
-
180
-
181
-
 182
182 -
 183
183 -
 184
184 -
 185
185 -
 186
186 -
 187
187 -
 188
188 -
 189
189 -
 190
190 -
 191
191 -
 192
192 -
 193
193 -
 194
194 -
 195
195 -
 196
196 -
 197
197 -
 198
198 -
 199
199 -
 200
200 -
 201
201 -
 202
202 -
203
-
204
-
205
-
206
-
207
-
208
-
209
-
210
-
211
-
212
-
213
-
214
-
215
-
216
-
217
-
218
-
219
-
220
-
221
-
222
-
223
-
224
-
225
-
226
-
227
-
228
-
229
-
230
-
231
-
232
-
233
-
234
-
235
-
236
-
237
-
238
-
239
-
240
-
241
-
242
-
243
-
244
 |
 |

Sustainability statements 14
192 Annual Report 2014
ights. Further, emissions from air freight for
distribution are calculated based on the amount of
tonne-kilometers transported between airports
(distinguishing between short, medium and long
hauls), including an estimate (based on actual data
of the lanes with the largest volumes) for trucking
from sites and distribution centers to airports and vice
versa. Express shipments are generally a mix of road
and air transport, depending on the distance.
Therefore the assumption is applied that shipments
over less than 600 km are transported by road and
the rest of the shipments by air (those emissions by
air are calculated in the same way as air freight). For
sea transport, only data on transported volume were
available so an estimate had to be made about the
average weight of a container. Transportation to and
from ports is not registered. This fore and aft part of
sea transport was estimated to be around 3% of the
total distance (based on actual data of the lanes with
the largest volumes), consisting of a mix of
modalities, and was added to the total emissions
accordingly. CO2 emissions from road transport were
also calculated based on tonne-kilometers. If data
were incomplete, the emissions were estimated
based on sales volumes. Return travel of vehicles is
not included in the data for sea and road distribution.
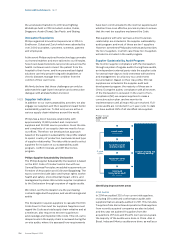
Sustainability governance
Sustainability is strongly embedded in our core
business processes, like innovation (EcoDesign),
sourcing (Supplier Sustainability Involvement
Program), manufacturing (Green Manufacturing 2015)
and Logistics (Green Logistics) and projects like the
Circular Economy initiative.
The Sustainability Board is the highest governing
sustainability body in Philips, chaired by Jim Andrew,
member of the Executive Committee. Three other
Executive Committee members sit in the Sustainability
Board jointly with sector and functional executives. The
Sustainability Board convenes four times per year,
denes Philips’ sustainability strategy and programs,
monitors progress and takes corrective action where
needed.
Progress on Sustainability is communicated internally
on a quarterly basis to Philips sta and at least annually
in the Executive Committee and Supervisory Board.
External assurance
KPMG has provided reasonable assurance on whether
the information in chapter 14, Sustainability
statements, of this Annual Report and section 5.2,
Social performance, of this Annual Report and section
5.3, Environmental performance, of this Annual Report
presents fairly, in all material respects, the sustainability
performance in accordance with the reporting criteria.
We refer to section 14.4, Independent Auditor’s
Assurance Report, of this Annual Report.
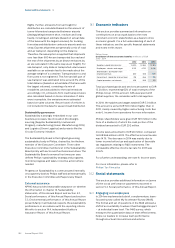
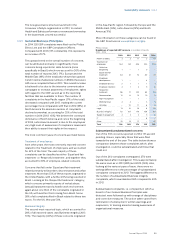
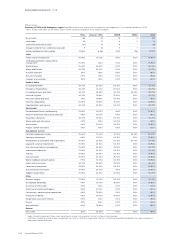
14.1 Economic indicators
This section provides summarized information on
contributions on an accruals basis to the most
important economic stakeholders as a basis to drive
economic growth. For a full understanding of each of
these indicators, see the specic nancial statements
and notes in this report.
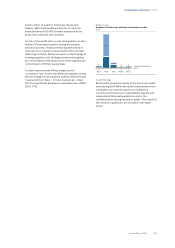
Philips Group
Distribution of direct economic benets in millions of EUR
2012 - 2014
2012 2013 2014
Suppliers: goods and services 13,505 12,653 13,185
Employees: salaries and wages 5,221 4,722 5,018
Shareholders: distribution from
retained earnings 687 678 729
Government: corporate income taxes 218 466 26
Capital providers: net interest 326 269 251
Total purchased goods and services amounted to EUR
13.2 billion, representing 62% of total revenues of the
Philips Group. Of this amount, 64% was spent with
global suppliers, the remainder with local suppliers.
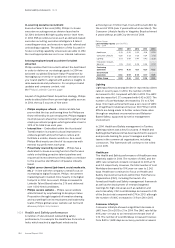
In 2014, the salaries and wages totaled EUR 5.0 billion.
This amount is some EUR 300 million higher than in
2013, mainly caused by higher restructuring costs. See
note 6, Income from operations for more information.
Philips’ shareholders were given EUR 729 million in the
form of a dividend, of which the cash portion of the
dividend amounted to EUR 292 million.
Income taxes amounted to EUR 26 million, compared
to EUR 466 million in 2013. The eective income tax rate
was 14.1%. The decrease in 2014 was mainly due to
lower income before tax and application of favorable
tax regulations relating to R&D investments. The
comparable eective income tax rate for 2013 was
30.6%.
For a further understanding, see note 8, Income taxes.
For more information, please refer to
Philips’ Tax Principles.
14.2 Social statements
This section provides additional information on (some
of) the social performance parameters reported in
section 5.2, Social performance, of this Annual Report.
14.2.1 Engaging our employees
In 2014 we implemented a brief, complementary, team-
focused survey called My Accelerate! Survey (MAS).
The format and set of questions in the MAS allowed a
shift of accountability to where it has the biggest impact
– at individual team level. The MAS survey, which
measures the quantitative data on team eectiveness,
helps our leaders to increase team performance
through structural interventions and actions.