Philips 2014 Annual Report Download - page 29
Download and view the complete annual report
Please find page 29 of the 2014 Philips annual report below. You can navigate through the pages in the report by either clicking on the pages listed below, or by using the keyword search tool below to find specific information within the annual report.-
 1
1 -
2
-
3
-
4
-
5
-
6
-
7
-
8
-
9
-
10
-
11
-
12
-
13
-
14
-
15
-
16
-
17
-
18
-
 19
19 -
 20
20 -
 21
21 -
 22
22 -
 23
23 -
 24
24 -
 25
25 -
 26
26 -
 27
27 -
 28
28 -
 29
29 -
 30
30 -
 31
31 -
 32
32 -
 33
33 -
 34
34 -
 35
35 -
 36
36 -
 37
37 -
 38
38 -
 39
39 -
40
-
41
-
42
-
43
-
44
-
45
-
46
-
47
-
48
-
49
-
50
-
51
-
52
-
53
-
54
-
55
-
56
-
57
-
58
-
59
-
60
-
61
-
62
-
63
-
64
-
65
-
66
-
67
-
68
-
69
-
70
-
71
-
72
-
73
-
74
-
75
-
76
-
77
-
78
-
79
-
80
-
81
-
82
-
83
-
84
-
85
-
86
-
87
-
88
-
89
-
90
-
91
-
92
-
93
-
94
-
95
-
96
-
97
-
98
-
99
-
100
-
101
-
102
-
103
-
104
-
105
-
106
-
107
-
108
-
109
-
110
-
111
-
112
-
113
-
114
-
115
-
116
-
117
-
118
-
119
-
120
-
121
-
122
-
123
-
124
-
125
-
126
-
127
-
128
-
129
-
130
-
131
-
132
-
133
-
134
-
135
-
136
-
137
-
138
-
139
-
140
-
141
-
142
-
143
-
144
-
145
-
146
-
147
-
148
-
149
-
150
-
151
-
152
-
153
-
154
-
155
-
156
-
157
-
158
-
159
-
160
-
161
-
162
-
163
-
164
-
165
-
166
-
167
-
168
-
169
-
170
-
171
-
172
-
173
-
174
-
175
-
176
-
177
-
178
-
179
-
180
-
181
-
182
-
183
-
184
-
185
-
186
-
187
-
188
-
189
-
190
-
191
-
192
-
193
-
194
-
195
-
196
-
197
-
198
-
199
-
200
-
201
-
202
-
203
-
204
-
205
-
206
-
207
-
208
-
209
-
210
-
211
-
212
-
213
-
214
-
215
-
216
-
217
-
218
-
219
-
220
-
221
-
222
-
223
-
224
-
225
-
226
-
227
-
228
-
229
-
230
-
231
-
232
-
233
-
234
-
235
-
236
-
237
-
238
-
239
-
240
-
241
-
242
-
243
-
244
 |
 |

Group performance 5.1.16
Annual Report 2014 29
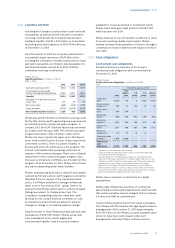
Philips Group
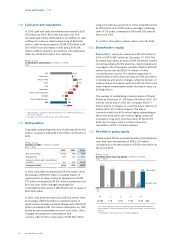
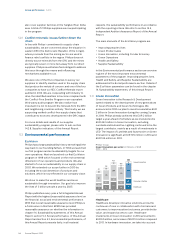
Cash ows from acquisitions and nancial assets,
divestments and derivatives in millions of EUR
2010 - 2014
360
(241)
119
‘10
132
(550)
(418)
‘11
(43)
(428)
(471)
‘12
(8)
(24)
(32)
‘13
80 Divestments and derivatives
(258) Acquisitions and financial assets
(178)
‘14
Acquisitions and nancial assets
The net cash impact of acquisitions of businesses and
nancial assets in 2014 was a total of EUR 258 million.
There was a EUR 177 million outow for acquisitions of
businesses, mainly related to the acquisition of a 51%
interest in the General Lighting Company (GLC) in The
Kingdom of Saudi Arabia (KSA), and a EUR 81 million
outow for nancial assets, mainly in the form of a EUR
60 million loan to TPV Technology Limited.
The net cash impact of acquisitions of businesses and
nancial assets in 2013, was a total of EUR 24 million.
There was a EUR 11 million outow for acquisitions of
businesses and a EUR 13 million outow for nancial
assets.
Divestments and derivatives
Cash proceeds of EUR 87 million were received mainly
from divestment of the Shakespeare business and the
sale of shares in Neusoft. Cash ows from derivatives
and current nancial assets led to a net cash outow of
EUR 7 million.
In 2013, cash proceeds of EUR 93 million were received
from divestments, mainly of non-strategic businesses
within Healthcare. Cash ows from derivatives and
current nancial assets led to a net cash outow of EUR
101 million.
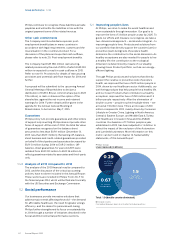
Cash ows from nancing activities
Net cash used for nancing activities in 2014 was EUR
1,189 million. Philips’ shareholders were given EUR 729
million in the form of a dividend, of which the cash
portion of the dividend amounted to EUR 292 million.
The net impact of changes in debt was a decrease of
EUR 301 million. Additionally, net cash outows for
share buy-back and share delivery totaled EUR 596
million.
Net cash used for nancing activities in 2013 was EUR
1,241 million. Philips’ shareholders were given EUR 678
million in the form of a dividend, of which the cash
portion of the dividend amounted to EUR 272 million.
The net impact of changes in debt was a decrease of
EUR 407 million, including the redemption of a USD 143
million bond. Additionally, net cash outows for share
buy-back and share delivery totaled EUR 562 million.
5.1.16 Cash ows from discontinued operations
In 2014, cash from discontinued operations amounted
to an inow of EUR 193 million. The combined
Automotive and Lumileds businesses had a cash inow
of EUR 240 million attributable to operating activities.
The Television business used net cash of EUR 8 million,
attributable to operating activities. The Audio, Video,
Multimedia and Accessories business used net cash of
EUR 19 million, with cash outows from operating
activities of EUR 107 million, partly oset by EUR 88
million of cash inows from investing activities.
In 2013, EUR 115 million cash was used by discontinued
operations. The combined Automotive and Lumileds
businesses had a cash inow of EUR 94 million
attributable to operating activities. The Television
business used net cash of EUR 138 million, attributable
to cash outflows of EUR 91 million for operating
activities and EUR 47 million for investing activities. The
Audio, Video, Multimedia and Accessories business
used net cash of EUR 72 million attributable to
operating activities.
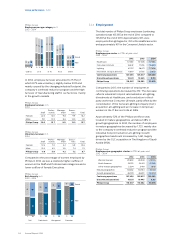
5.1.17 Financing
Condensed consolidated balance sheets for the years
2012, 2013 and 2014 are presented below:
Philips Group
Condensed consolidated balance sheet1) in millions of EUR
2012 - 2014
2012 2013 2014
Intangible assets 10,679 9,766 10,526
Property, plant and equipment 2,959 2,780 2,095
Inventories 3,495 3,240 3,314
Receivables 4,858 4,892 5,040
Assets held for sale 43 507 1,613
Other assets 3,213 2,909 3,891
Payables (6,210) (5,435) (5,293)
Provisions (2,956) (2,554) (3,445)
Liabilities directly associated with
assets held for sale (27) (348) (349)
Other liabilities (4,169) (3,094) (4,193)
Net asset employed 11,885 12,663 13,199
Cash and cash equivalents 3,834 2,465 1,873
Debt (4,534) (3,901) (4,104)
Net debt (700) (1,436) (2,231)
Non-controlling interests (34) (13) (101)
Shareholders’ equity (11,151) (11,214) (10,867)
Financing (11,885) (12,663) (13,199)
1) Please refer to section 12.6, Consolidated balance sheets, of this Annual
Report
The nancing structure in 2015 will be broadly in line
with 2014.