Philips 2014 Annual Report Download - page 4
Download and view the complete annual report
Please find page 4 of the 2014 Philips annual report below. You can navigate through the pages in the report by either clicking on the pages listed below, or by using the keyword search tool below to find specific information within the annual report.-
 1
1 -
 2
2 -
 3
3 -
 4
4 -
 5
5 -
 6
6 -
 7
7 -
 8
8 -
 9
9 -
 10
10 -
 11
11 -
 12
12 -
 13
13 -
 14
14 -
 15
15 -
16
-
17
-
18
-
19
-
20
-
21
-
22
-
23
-
24
-
25
-
26
-
27
-
28
-
29
-
30
-
31
-
32
-
33
-
34
-
35
-
36
-
37
-
38
-
39
-
40
-
41
-
42
-
43
-
44
-
45
-
46
-
47
-
48
-
49
-
50
-
51
-
52
-
53
-
54
-
55
-
56
-
57
-
58
-
59
-
60
-
61
-
62
-
63
-
64
-
65
-
66
-
67
-
68
-
69
-
70
-
71
-
72
-
73
-
74
-
75
-
76
-
77
-
78
-
79
-
80
-
81
-
82
-
83
-
84
-
85
-
86
-
87
-
88
-
89
-
90
-
91
-
92
-
93
-
94
-
95
-
96
-
97
-
98
-
99
-
100
-
101
-
102
-
103
-
104
-
105
-
106
-
107
-
108
-
109
-
110
-
111
-
112
-
113
-
114
-
115
-
116
-
117
-
118
-
119
-
120
-
121
-
122
-
123
-
124
-
125
-
126
-
127
-
128
-
129
-
130
-
131
-
132
-
133
-
134
-
135
-
136
-
137
-
138
-
139
-
140
-
141
-
142
-
143
-
144
-
145
-
146
-
147
-
148
-
149
-
150
-
151
-
152
-
153
-
154
-
155
-
156
-
157
-
158
-
159
-
160
-
161
-
162
-
163
-
164
-
165
-
166
-
167
-
168
-
169
-
170
-
171
-
172
-
173
-
174
-
175
-
176
-
177
-
178
-
179
-
180
-
181
-
182
-
183
-
184
-
185
-
186
-
187
-
188
-
189
-
190
-
191
-
192
-
193
-
194
-
195
-
196
-
197
-
198
-
199
-
200
-
201
-
202
-
203
-
204
-
205
-
206
-
207
-
208
-
209
-
210
-
211
-
212
-
213
-
214
-
215
-
216
-
217
-
218
-
219
-
220
-
221
-
222
-
223
-
224
-
225
-
226
-
227
-
228
-
229
-
230
-
231
-
232
-
233
-
234
-
235
-
236
-
237
-
238
-
239
-
240
-
241
-
242
-
243
-
244
 |
 |
Performance highlights 1
4 Annual Report 2014
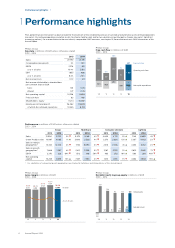
1Performance highlights
Prior-period nancial information has been restated for the treatment of the combined businesses of Lumileds and Automotive as discontinued operations
(see note 3, Discontinued operations and other assets classied as held for sale) and for two voluntary accounting policy changes (see note 1, Signicant
accounting policies). For a reconciliation to the most directly comparable GAAP measures, see chapter 15, Reconciliation of non-GAAP information, of this
Annual Report.
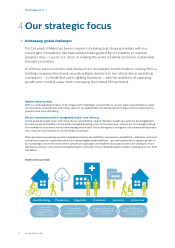
Philips Group
Key data in millions of EUR unless otherwise stated
2013 - 2014
2013 2014
Sales 21,990 21,391
Comparable sales growth 3% (1)%
EBITA 2,276 821
as a % of sales 10.4% 3.8%
EBIT 1,855 486
as a % of sales 8.4% 2.3%
Net income (loss) 1,172 411
Net income attributable to shareholders
per common share in EUR:
basic 1.28 0.45
diluted 1.27 0.45
Net operating capital 10,238 8,838
Free cash ow 82 497
Shareholders’ equity 11,214 10,867
Employees at December 31 116,082 113,678
of which discontinued operations 10,445 8,313
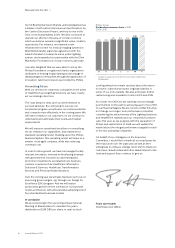
Philips Group
Free cash ow in millions of EUR
2010 - 2014
1,691
(543)
1,148
‘10
610
(663)
(53)
‘11
1,886
(241)
1,645
‘12
912
(830)
82
‘13
1,303
Operating cash flows
(806) Net capital expenditures
497 Free cash flow
‘14
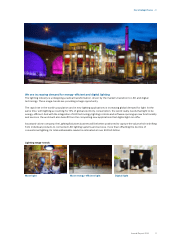
Performance in millions of EUR unless otherwise stated
2013 - 2014
Group Healthcare Consumer Lifestyle Lighting
2013 2014 2013 2014 2013 2014 2013 2014
Sales 21,990 21,391 3% 9,575 9,186 4% 4,605 4,731 3% 7,145 6,869 4%
Green Product sales 10,997 11,065 1% 3,690 3,508 4% 2,270 2,605 15% 5,037 4,952 2%
Sales in mature
geographies1) 14,322
14,004
2% 7,154 6,890 4% 2,418 2,508 4% 4,254 4,182 2%
Sales in growth
geographies1) 7,668 7,387 4% 2,421 2,296 5% 2,187 2,223 2% 2,891 2,687 7%
EBITA 2,276 821 64% 1,512 616 59% 483 573 19% 580 293 49%
Net operating
capital 10,238 8,838 14% 7,437 7,565 2% 1,261 1,353 7% 4,462 3,638 18%
1) For a denition of mature and growth geographies see chapter 18, Denitions and abbreviations, of this Annual Report
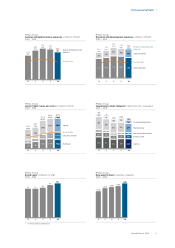
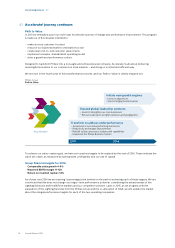
Philips Group
Gross margin in millions of EUR
2010 - 2014
8,173
‘10
42.3%
8,051
‘11
40.4% 8,729
‘12
39.3% 9,337
‘13
42.5%
8,206 In value
‘14
38.4%
As a % of sales
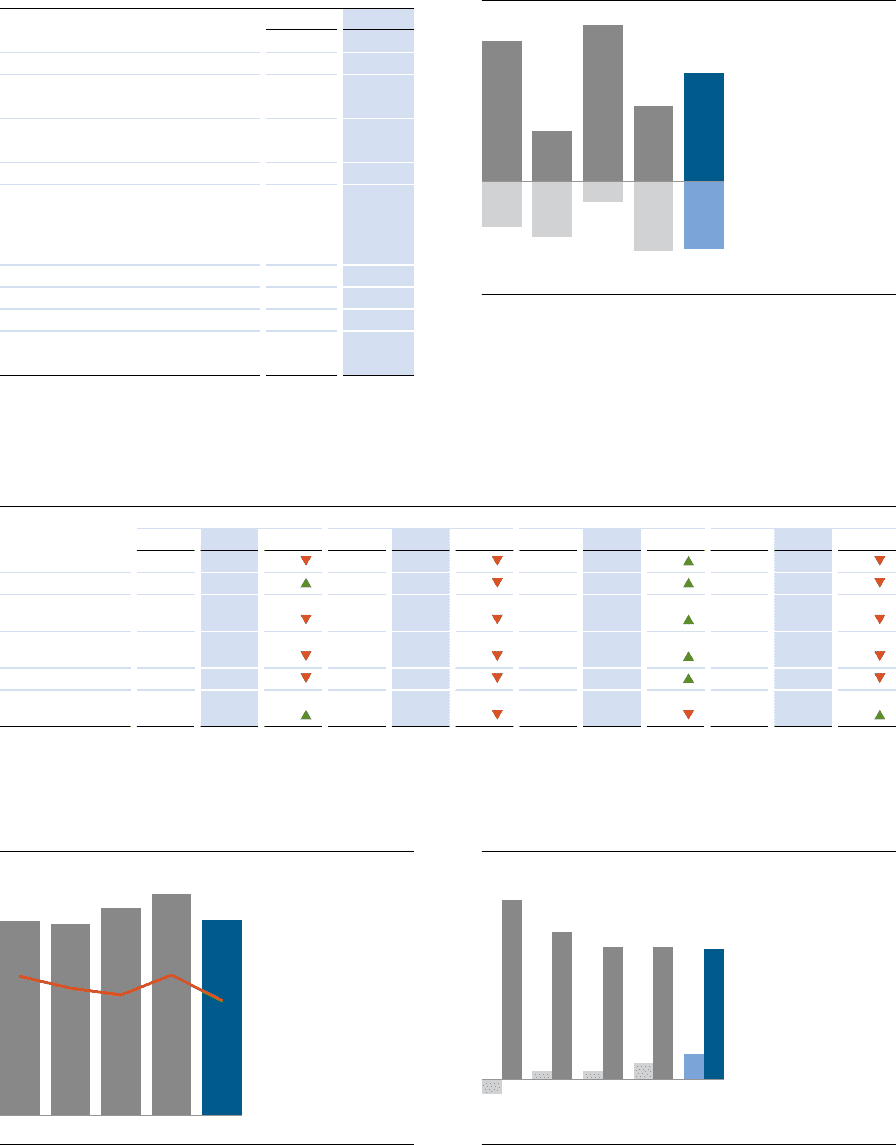
Philips Group
Net debt (cash) to group equity in billions of EUR
2010 - 2014
(1.2)
15.1
‘10
0.7
12.4
‘11
0.7
11.2
‘12
1.4
11.2
‘13
2.2 Net debt (cash)
11.0 Group equity
‘14