Philips 2014 Annual Report Download - page 32
Download and view the complete annual report
Please find page 32 of the 2014 Philips annual report below. You can navigate through the pages in the report by either clicking on the pages listed below, or by using the keyword search tool below to find specific information within the annual report.-
 1
1 -
2
-
3
-
4
-
5
-
6
-
7
-
8
-
9
-
10
-
11
-
12
-
13
-
14
-
15
-
16
-
17
-
18
-
19
-
20
-
21
-
 22
22 -
 23
23 -
 24
24 -
 25
25 -
 26
26 -
 27
27 -
 28
28 -
 29
29 -
 30
30 -
 31
31 -
 32
32 -
 33
33 -
 34
34 -
 35
35 -
 36
36 -
 37
37 -
 38
38 -
 39
39 -
 40
40 -
 41
41 -
 42
42 -
43
-
44
-
45
-
46
-
47
-
48
-
49
-
50
-
51
-
52
-
53
-
54
-
55
-
56
-
57
-
58
-
59
-
60
-
61
-
62
-
63
-
64
-
65
-
66
-
67
-
68
-
69
-
70
-
71
-
72
-
73
-
74
-
75
-
76
-
77
-
78
-
79
-
80
-
81
-
82
-
83
-
84
-
85
-
86
-
87
-
88
-
89
-
90
-
91
-
92
-
93
-
94
-
95
-
96
-
97
-
98
-
99
-
100
-
101
-
102
-
103
-
104
-
105
-
106
-
107
-
108
-
109
-
110
-
111
-
112
-
113
-
114
-
115
-
116
-
117
-
118
-
119
-
120
-
121
-
122
-
123
-
124
-
125
-
126
-
127
-
128
-
129
-
130
-
131
-
132
-
133
-
134
-
135
-
136
-
137
-
138
-
139
-
140
-
141
-
142
-
143
-
144
-
145
-
146
-
147
-
148
-
149
-
150
-
151
-
152
-
153
-
154
-
155
-
156
-
157
-
158
-
159
-
160
-
161
-
162
-
163
-
164
-
165
-
166
-
167
-
168
-
169
-
170
-
171
-
172
-
173
-
174
-
175
-
176
-
177
-
178
-
179
-
180
-
181
-
182
-
183
-
184
-
185
-
186
-
187
-
188
-
189
-
190
-
191
-
192
-
193
-
194
-
195
-
196
-
197
-
198
-
199
-
200
-
201
-
202
-
203
-
204
-
205
-
206
-
207
-
208
-
209
-
210
-
211
-
212
-
213
-
214
-
215
-
216
-
217
-
218
-
219
-
220
-
221
-
222
-
223
-
224
-
225
-
226
-
227
-
228
-
229
-
230
-
231
-
232
-
233
-
234
-
235
-
236
-
237
-
238
-
239
-
240
-
241
-
242
-
243
-
244
 |
 |

Group performance 5.1.23
32 Annual Report 2014
Philips continues to recognize these liabilities as trade
payables and will settle the liabilities in line with the
original payment terms of the related invoices.
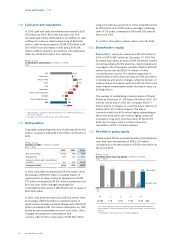
Other cash commitments
The Company and its subsidiaries sponsor post-
employment benet plans in many countries in
accordance with legal requirements, customs and the
local situation in the countries involved. For a
discussion of the plans and expected cash outows,
please refer to note 20, Post-employment benets.
The Company had EUR 380 million restructuring-
related provisions by the end of 2014, of which EUR 230
million is expected to result in cash outows in 2015.
Refer to note 19, Provisions for details of restructuring
provisions and potential cash ow impact for 2014 and
further.
A proposal will be submitted to the upcoming Annual
General Meeting of Shareholders to declare a
distribution of EUR 0.80 per common share (up to EUR
735 million), in cash or shares at the option of the
shareholder, against the net income and retained
earnings for 2014. Further details will be given in the
agenda for the Annual General Meeting of
Shareholders, to be held on May 7, 2015.
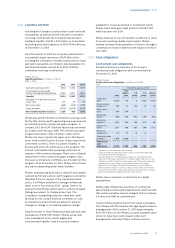
Guarantees
Philips’ policy is to provide guarantees and other letters
of support only in writing. Philips does not provide other
forms of support. At the end of 2014, the total fair value
of guarantees recognized on the balance sheet
amounted to less than EUR 1 million (December 31,
2013: less than EUR 1 million). Remaining o-balance-
sheet business and credit-related guarantees provided
on behalf of third parties and associates decreased by
EUR 13 million during 2014 to EUR 21 million. O-
balance-sheet guarantees for year end 2013 were
restated from EUR 333 million to EUR 34 million to
reect guarantees related to associates and third-party
only.
5.1.24 Analysis of 2013 compared to 2012
The analysis of the 2013 nancial results compared to
2012, and the discussion of the critical accounting
policies, have not been included in this Annual Report.
These sections are included in Philips’ Form 20-F for
the nancial year 2014, which will be led electronically
with the US Securities and Exchange Commission.
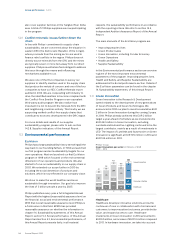
5.2 Social performance
Our businesses provide innovative solutions that
address major trends aecting the world – the demand
for aordable healthcare, the need for greater energy
eciency, and the desire for personal well-being.
Philips further strengthened its focus on sustainability
in 2014 through a number of initiatives described in the
Social and Environmental performance sections.
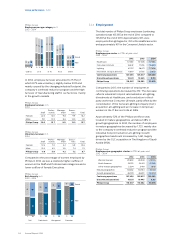
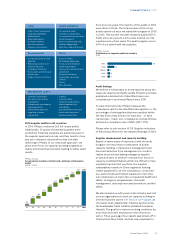
5.2.1 Improving people’s lives
At Philips, we strive to make the world healthier and
more sustainable through innovation. Our goal is to
improve the lives of 3 billion people a year by 2025. To
guide our eorts and measure our progress, we take a
two-dimensional approach – social and ecological – to
improving people’s lives. Products and solutions from
our portfolio that directly support the curative (care) or
preventive (well-being) side of people’s health,
determine the contribution to the social dimension. As
healthy ecosystems are also needed for people to live
a healthy life, the contribution to the ecological
dimension is determined by means of our steadily
growing Green Product portfolio, such as our energy-
ecient lighting.
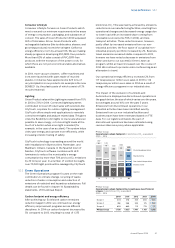
Through Philips products and solutions that directly
support the curative or preventive side of people’s
health, we improved the lives of 670 million people in
2014, driven by our Healthcare sector. Additionally, our
well-being products that help people live a healthy life,
and our Green Products that contribute to a healthy
ecosystem, improved the lives of 290 million and 1.5
billion people respectively. After the elimination of
double counts – people touched multiple times – we
arrived at 1.9 billion lives. This is an increase of 200
million compared to 2013, mainly driven by Consumer
Lifestyle in Greater China, Lighting in North America,
Central & Eastern Europe, and Middle East & Turkey,
and Healthcare in Greater China and the ASEAN
countries. Our baseline of 1.7 billion people a year,
established in 2012, has been adjusted to 1.6 billion to
reect the impact of the exclusion of the Automotive
and Lumileds businesses. More information on this
metric can be found in chapter 14, Sustainability
statements, of this Annual Report.
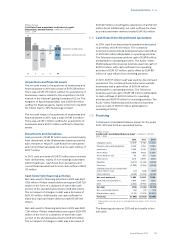
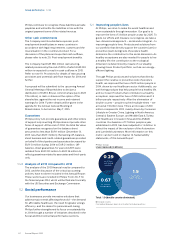
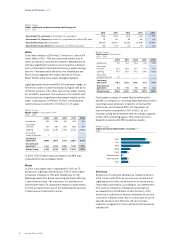
Philips Group
Lives improved (in billions)
0.29
by Philips
well-being
products
0.67
by Philips
care products
1.5
by Philips
Green Products
Total: 1.9 (double counts eliminated)
Double counts
Conceptual drawing, areas do not reect actual proportions