Philips 2014 Annual Report Download - page 65
Download and view the complete annual report
Please find page 65 of the 2014 Philips annual report below. You can navigate through the pages in the report by either clicking on the pages listed below, or by using the keyword search tool below to find specific information within the annual report.-
 1
1 -
2
-
3
-
4
-
5
-
6
-
7
-
8
-
9
-
10
-
11
-
12
-
13
-
14
-
15
-
16
-
17
-
18
-
19
-
20
-
21
-
22
-
23
-
24
-
25
-
26
-
27
-
28
-
29
-
30
-
31
-
32
-
33
-
34
-
35
-
36
-
37
-
38
-
39
-
40
-
41
-
42
-
43
-
44
-
45
-
46
-
47
-
48
-
49
-
50
-
51
-
52
-
53
-
54
-
 55
55 -
 56
56 -
 57
57 -
 58
58 -
 59
59 -
 60
60 -
 61
61 -
 62
62 -
 63
63 -
 64
64 -
 65
65 -
 66
66 -
 67
67 -
 68
68 -
 69
69 -
 70
70 -
 71
71 -
 72
72 -
 73
73 -
 74
74 -
 75
75 -
76
-
77
-
78
-
79
-
80
-
81
-
82
-
83
-
84
-
85
-
86
-
87
-
88
-
89
-
90
-
91
-
92
-
93
-
94
-
95
-
96
-
97
-
98
-
99
-
100
-
101
-
102
-
103
-
104
-
105
-
106
-
107
-
108
-
109
-
110
-
111
-
112
-
113
-
114
-
115
-
116
-
117
-
118
-
119
-
120
-
121
-
122
-
123
-
124
-
125
-
126
-
127
-
128
-
129
-
130
-
131
-
132
-
133
-
134
-
135
-
136
-
137
-
138
-
139
-
140
-
141
-
142
-
143
-
144
-
145
-
146
-
147
-
148
-
149
-
150
-
151
-
152
-
153
-
154
-
155
-
156
-
157
-
158
-
159
-
160
-
161
-
162
-
163
-
164
-
165
-
166
-
167
-
168
-
169
-
170
-
171
-
172
-
173
-
174
-
175
-
176
-
177
-
178
-
179
-
180
-
181
-
182
-
183
-
184
-
185
-
186
-
187
-
188
-
189
-
190
-
191
-
192
-
193
-
194
-
195
-
196
-
197
-
198
-
199
-
200
-
201
-
202
-
203
-
204
-
205
-
206
-
207
-
208
-
209
-
210
-
211
-
212
-
213
-
214
-
215
-
216
-
217
-
218
-
219
-
220
-
221
-
222
-
223
-
224
-
225
-
226
-
227
-
228
-
229
-
230
-
231
-
232
-
233
-
234
-
235
-
236
-
237
-
238
-
239
-
240
-
241
-
242
-
243
-
244
 |
 |

Sector performance 6.4.1
Annual Report 2014 65
Philips Wearable Sensing Technologies (WeST) delivers
accurate and reliable continuous personal health
measurements through modules specically designed
for integration in wearable devices. The rst-generation
module fueled a new product category of heart rate-
monitoring sport watches that work without a chest-
strap.
Philips Intellectual Property & Standards
Philips IP&S proactively pursues the creation of new
intellectual property in close co-operation with Philips’
operating businesses and Philips Group Innovation.
IP&S is a leading industrial IP organization providing
world-class IP solutions to Philips’ businesses to
support their growth, competitiveness and protability.
Philips’ IP portfolio currently consists of approximately
14,200 patent families (68,400 patent rights), 2,780
trademark families (46,600 trademark rights), 3,650
design families (91,400 design rights) and 2,130 domain
name families (4,850 domain names). Philips led 1,680
patent applications in 2014, with a strong focus on the
growth areas in health and well-being.
IP&S participates in the setting of standards to create
new business opportunities for the Philips operating
businesses. A substantial portion of revenue and costs
is allocated to the operating businesses. Philips
believes its business as a whole is not materially
dependent on any particular patent or license, or any
particular group of patents and licenses.
Group and Regional Costs
Group and Regional organizations support the creation
of value, connecting Philips with key stakeholders,
especially our employees, customers, government and
society. These organizations include the Executive
Committee, Brand Management, Sustainability, New
Venture Integration, the Group functions related to
strategy, human resources, legal and nance, as well as
country and regional management.
Accelerate! investments
Innovation, Group & Services plays an important role in
the Accelerate! program, notably by helping to improve
the end-to-end value chain. The End-to-End approach
consists of three core processes: Idea-to-Market,
Market-to-Order, and Order-to-Cash. Innovation,
Group & Services supports a more ecient and eective
Idea-to-Market process in ve focal areas: speeding up
time-to-market, portfolio optimization, driving
breakthrough innovation, improving innovation
competencies, and strengthening the position of
Philips as an innovation leader.
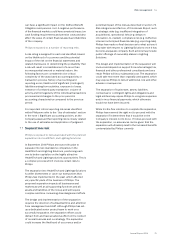
6.4.2 2014 nancial performance
Philips Innovation, Group & Services
Key data in millions of EUR unless otherwise stated
2012 - 2014
2012 2013 2014
Sales 629 665 605
Sales growth
% increase (decrease), nominal (8)% 6% (9)%
% increase (decrease),
comparable1) (6)% 0% (12)%
EBITA of:
Group Innovation (149) (134) (197)
IP Royalties 253 312 299
Group and regional costs (161) (175) (205)
Accelerate! investment (128) (137) (131)
Pensions 24 (41) (12)
Service units and other (587) (124) (415)
EBITA 1) (748) (299) (661)
EBIT (756) (302) (675)
Net operating capital (NOC)1) (4,500) (2,922) (3,718)
Cash ows before nancing
activities1) (851) (2,140) (1,586)
Employees (in FTEs) 11,697 12,703 13,853
1) For a reconciliation to the most directly comparable GAAP measures,
see chapter 15, Reconciliation of non-GAAP information, of this Annual
Report
In 2014, sales amounted to EUR 605 million, and were
mainly related to IP Royalty income and our OEM
Remote Control business. Sales were EUR 60 million
lower than in 2013, mainly due to lower income from
Group Innovation and IP Royalties.
EBITA amounted to a loss of EUR 661 million, compared
to a loss of EUR 299 million in 2013. In 2014, EBITA
included EUR 110 million of restructuring and
acquisition-related charges, EUR 244 million of
provisions related to various legal matters and a EUR 27
million past-service pension gain in the Netherlands.
2013 EBITA included EUR 3 million of restructuring and
acquisition-related charges and a pension settlement
loss of EUR 25 million.
EBITA at Group Innovation was a EUR 63 million higher
net cost than in 2013, mainly due to higher restructuring
charges and higher investments in emerging business
areas.
EBITA at Group and Regional Overhead costs were EUR
30 million lower than in 2013, mainly due to higher
restructuring costs.
Accelerate! investments amounted to EUR 131 million in
2014, and include investments in IT infrastructure,
internal departments and external consultancy
dedicated to the Accelerate! program.
EBITA at Pensions amounted to a net cost of EUR 12
million, and represent costs related to deferred
pensioners covered by company plans. In 2013,
Pensions amounted to a net cost of EUR 41 million and