Philips 2014 Annual Report Download - page 27
Download and view the complete annual report
Please find page 27 of the 2014 Philips annual report below. You can navigate through the pages in the report by either clicking on the pages listed below, or by using the keyword search tool below to find specific information within the annual report.-
 1
1 -
2
-
3
-
4
-
5
-
6
-
7
-
8
-
9
-
10
-
11
-
12
-
13
-
14
-
15
-
16
-
 17
17 -
 18
18 -
 19
19 -
 20
20 -
 21
21 -
 22
22 -
 23
23 -
 24
24 -
 25
25 -
 26
26 -
 27
27 -
 28
28 -
 29
29 -
 30
30 -
 31
31 -
 32
32 -
 33
33 -
 34
34 -
 35
35 -
 36
36 -
 37
37 -
38
-
39
-
40
-
41
-
42
-
43
-
44
-
45
-
46
-
47
-
48
-
49
-
50
-
51
-
52
-
53
-
54
-
55
-
56
-
57
-
58
-
59
-
60
-
61
-
62
-
63
-
64
-
65
-
66
-
67
-
68
-
69
-
70
-
71
-
72
-
73
-
74
-
75
-
76
-
77
-
78
-
79
-
80
-
81
-
82
-
83
-
84
-
85
-
86
-
87
-
88
-
89
-
90
-
91
-
92
-
93
-
94
-
95
-
96
-
97
-
98
-
99
-
100
-
101
-
102
-
103
-
104
-
105
-
106
-
107
-
108
-
109
-
110
-
111
-
112
-
113
-
114
-
115
-
116
-
117
-
118
-
119
-
120
-
121
-
122
-
123
-
124
-
125
-
126
-
127
-
128
-
129
-
130
-
131
-
132
-
133
-
134
-
135
-
136
-
137
-
138
-
139
-
140
-
141
-
142
-
143
-
144
-
145
-
146
-
147
-
148
-
149
-
150
-
151
-
152
-
153
-
154
-
155
-
156
-
157
-
158
-
159
-
160
-
161
-
162
-
163
-
164
-
165
-
166
-
167
-
168
-
169
-
170
-
171
-
172
-
173
-
174
-
175
-
176
-
177
-
178
-
179
-
180
-
181
-
182
-
183
-
184
-
185
-
186
-
187
-
188
-
189
-
190
-
191
-
192
-
193
-
194
-
195
-
196
-
197
-
198
-
199
-
200
-
201
-
202
-
203
-
204
-
205
-
206
-
207
-
208
-
209
-
210
-
211
-
212
-
213
-
214
-
215
-
216
-
217
-
218
-
219
-
220
-
221
-
222
-
223
-
224
-
225
-
226
-
227
-
228
-
229
-
230
-
231
-
232
-
233
-
234
-
235
-
236
-
237
-
238
-
239
-
240
-
241
-
242
-
243
-
244
 |
 |

Group performance 5.1.12
Annual Report 2014 27
related to AVM&A, and EUR 31 million mainly related to
other dicontinued operations mainly net income on the
Television business, partly oset by the European
Commission’s Smartcard ne.
For further information, refer to note 3, Discontinued
operations and other assets classied as held for sale.
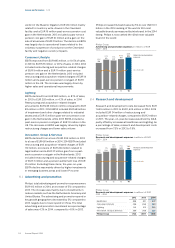
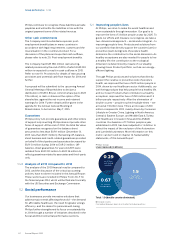
5.1.12 Net income
Net income decreased from EUR 1,172 million in 2013 to
EUR 411 million in 2014. The decrease was largely due
to lower EBIT of EUR 1,369 million, partly oset by lower
income tax charges of EUR 440 million and higher
results from investment in associates of EUR 87 million.
Basic earnings per common share from net income
attributable to shareholders decreased from EUR 1.28
per common share in 2013 to EUR 0.45 per common
share in 2014.
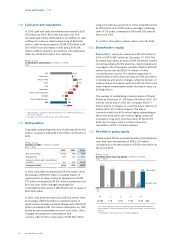
5.1.13 Acquisitions and divestments
Acquisitions
In 2014, Philips acquired Unisensor, a Danish healthcare
company, and a 51% interest in General Lighting
Company (GLC) based in The Kingdom of Saudi Arabia
(KSA). Philips also purchased some minor magnetic
resonance imaging (MRI) activities from Hologic, a US
healthcare company. Acquisitions in 2014 and previous
years led to post-merger integration charges of EUR 1
million in Healthcare, EUR 1 million in Consumer
Lifestyle and EUR 19 million in Lighting.
In 2013, there were four minor acquisitions. Acquisitions
in 2013 and previous years led to post-merger
integration charges totaling EUR 16 million in 2013:
Healthcare EUR 6 million, Consumer Lifestyle EUR 4
million, and Lighting EUR 6 million.
In 2012, Philips completed the acquisition of Indal
within Lighting. Acquisitions in 2012 and previous years
led to post-merger integration charges totaling EUR 50
million in 2012: Healthcare EUR 18 million, Consumer
Lifestyle EUR 18 million, and Lighting EUR 14 million.
Divestments
In 2014, Philips completed the divestment of its
Lifestyle Entertainment activities to Gibson Brands Inc.
Philips also completed two other divestments of
business activities which related to Healthcare and
Lighting activities.
In 2013, Philips completed several divestments of business
activities, mainly related to certain Healthcare activities.
In 2012, Philips completed several divestments of business
activities, namely the Television business, certain Lighting
manufacturing activities, Speech Processing activities and
certain Healthcare service activities.
Also in 2012, Philips agreed to extend its partnership with
Sara Lee Corp (Sara Lee) to drive growth in the global coffee
market. Under a new exclusive partnership framework, which
will run through to 2020, Philips will be the exclusive
SENSEO® consumer appliance manufacturer and distributor
for the duration of the agreement. As part of the agreement,
Philips divested its 50% ownership right in the SENSEO®
trademark to Sara Lee.
For details, please refer to
note 4, Acquisitions and
divestments
.
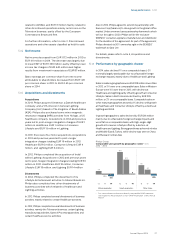
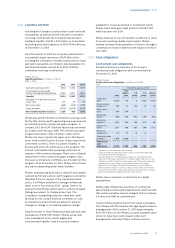
5.1.14 Performance by geographic cluster
In 2014, sales declined 1% on a comparable basis (-3%
nominally largely attributable due to unfavorable foreign
exchange impacts) mainly due to Healthcare and Lighting.
Sales in mature geographies were EUR 318 million lower than
in 2013, or 1% lower on a comparable basis. Sales in Western
Europe were 1% lower than in 2013, with declines at
Healthcare and Lighting partly offset by growth at Consumer
Lifestyle. Sales in North America declined by EUR 205
million, or 2% on a comparable basis. Comparable sales in
other mature geographies showed a 1% decline, with growth
at Healthcare and Consumer Lifestyle offset by a decline at
Lighting and IG&S.
In growth geographies, sales declined by EUR 281 million
mainly due to unfavorable foreign exchange impacts and
were flat on a comparable basis, with high-single-digit
growth at Consumer Lifestyle offset by a decline at
Healthcare and Lighting. Strong growth was achieved in India
and Middle East & Turkey, while decline was seen in China
and Russia & Central Asia.
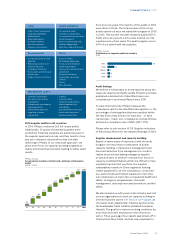
Philips Group
Comparable sales growth by geographic cluster1) in %
2012 - 2014
1.9
‘12
(0.3)
‘13
(1.3)
‘14
Mature geographies
13.6
‘12
8.9
‘13
0
‘14
Growth geographies
5.5
‘12
2.7
‘13
(0.9)
‘14
Philips Group
1) For a reconciliation to the most directly comparable GAAP measures,
see chapter 15, Reconciliation of non-GAAP information, of this Annual
Report