Philips 2014 Annual Report Download - page 231
Download and view the complete annual report
Please find page 231 of the 2014 Philips annual report below. You can navigate through the pages in the report by either clicking on the pages listed below, or by using the keyword search tool below to find specific information within the annual report.-
 1
1 -
2
-
3
-
4
-
5
-
6
-
7
-
8
-
9
-
10
-
11
-
12
-
13
-
14
-
15
-
16
-
17
-
18
-
19
-
20
-
21
-
22
-
23
-
24
-
25
-
26
-
27
-
28
-
29
-
30
-
31
-
32
-
33
-
34
-
35
-
36
-
37
-
38
-
39
-
40
-
41
-
42
-
43
-
44
-
45
-
46
-
47
-
48
-
49
-
50
-
51
-
52
-
53
-
54
-
55
-
56
-
57
-
58
-
59
-
60
-
61
-
62
-
63
-
64
-
65
-
66
-
67
-
68
-
69
-
70
-
71
-
72
-
73
-
74
-
75
-
76
-
77
-
78
-
79
-
80
-
81
-
82
-
83
-
84
-
85
-
86
-
87
-
88
-
89
-
90
-
91
-
92
-
93
-
94
-
95
-
96
-
97
-
98
-
99
-
100
-
101
-
102
-
103
-
104
-
105
-
106
-
107
-
108
-
109
-
110
-
111
-
112
-
113
-
114
-
115
-
116
-
117
-
118
-
119
-
120
-
121
-
122
-
123
-
124
-
125
-
126
-
127
-
128
-
129
-
130
-
131
-
132
-
133
-
134
-
135
-
136
-
137
-
138
-
139
-
140
-
141
-
142
-
143
-
144
-
145
-
146
-
147
-
148
-
149
-
150
-
151
-
152
-
153
-
154
-
155
-
156
-
157
-
158
-
159
-
160
-
161
-
162
-
163
-
164
-
165
-
166
-
167
-
168
-
169
-
170
-
171
-
172
-
173
-
174
-
175
-
176
-
177
-
178
-
179
-
180
-
181
-
182
-
183
-
184
-
185
-
186
-
187
-
188
-
189
-
190
-
191
-
192
-
193
-
194
-
195
-
196
-
197
-
198
-
199
-
200
-
201
-
202
-
203
-
204
-
205
-
206
-
207
-
208
-
209
-
210
-
211
-
212
-
213
-
214
-
215
-
216
-
217
-
218
-
219
-
220
-
 221
221 -
 222
222 -
 223
223 -
 224
224 -
 225
225 -
 226
226 -
 227
227 -
 228
228 -
 229
229 -
 230
230 -
 231
231 -
 232
232 -
 233
233 -
 234
234 -
 235
235 -
 236
236 -
 237
237 -
 238
238 -
 239
239 -
 240
240 -
 241
241 -
242
-
243
-
244
 |
 |
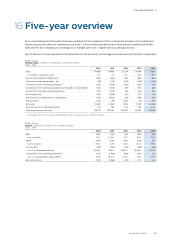
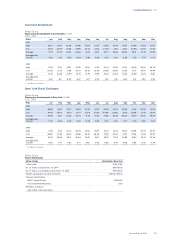
Five-year overview 16
Annual Report 2014 231
Philips Group
Key gures per share in EUR unless otherwise stated
2010 - 2014
2010 2011 2012 2013 2014
Sales per common share 20.49 20.90 24.11 24.14 23.37
EBITA per common share - diluted 2.08 1.39 1.08 2.47 0.89
Weighted average amount of shares outstanding:
- basic1) 941,691 952,809 922,101 911,072 915,193
- diluted1) 949,554 957,293 927,222 922,072 922,714
Basic earnings per common share:
Income (loss) from continuing operations attributable to
shareholders per share 1.11 (1.16) (0.19) 1.13 0.25
Net income (loss) attributable to shareholders 1.38 (1.53) (0.04) 1.28 0.45
Diluted earnings per common share:
Income (loss) from continuing operations attributable to
shareholders per share 1.10 (1.16) (0.19) 1.12 0.24
Net income (loss) attributable to shareholders 1.36 (1.53) (0.04) 1.27 0.45
Dividend distributed per common share 0.70 0.75 0.75 0.75 0.80
Total shareholder return per common share 2.94 (5.89) 4.37 7.50 (1.70)
Shareholders’ equity per common share 15.87 13.31 12.19 12.28 11.88
Price/earnings ratio 20.65 (14.03) (104.74) 23.58 96.60
Share price at year-end 22.92 16.28 19.90 26.65 24.15
Highest closing share price during the year 26.94 25.34 20.33 26.78 28.10
Lowest closing share price during the year 20.34 12.23 13.76 20.26 20.98
Average share price 23.35 18.11 16.92 23.33 24.00
Amount of common shares outstanding at year-end1) 946,506 926,095 914,591 913,338 914,389
1) In thousands of shares
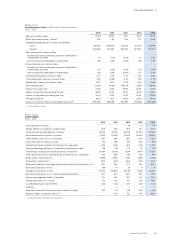
Philips Group
Sustainability
2010 - 2014
2010 2011 2012 2013 2014
Lives improved, in billions 1.6 1.7 1.9
Energy eciency of products, in lumen/watt 35.9 37.6 39.3 40.1 40.5
Collection and recycling amount, in tonnes 22,500 27,500 30,500 31,000 31,500
Recycled material in products, in tonnes 7,500 10,000 15,000 14,000 13,000
Green Product sales, as a % of total sales 36% 39% 46% 50% 52%
Green Innovation, in millions of euros 313 363 453 405 463
Operational carbon footprint, in kilotonnes CO2-equivalent 1,756 1,635 1,441 1,451 1,375
Operational energy eciency, in terajoules per million euro sales 1.45 1.33 1.13 1.17 1.14
Total energy consumption in manufacturing, in terajoules1) 12,464 12,030 12,014 11,963 11,257
Total carbon emissions in manufacturing, in kilotonnes CO2-equivalent 612 560 564 524 474
Water intake, in thousands m32,896 2,895 3,137 3,289 3,103
Total waste, in kilotonnes1) 96.2 87.0 80.6 75.9 75.0
Materials provided for recycling via external contractor per total waste, in % 79% 78% 77% 79% 80%
Restricted substances, in kilos 188 111 55 9 9
Hazardous substances, in kilos 60,272 63,604 67,530 35,118 28,310
ISO 14001 certication, as a % of all reporting organizations1) 94% 87% 69% 79% 79%
Employee Engagement Index, % favorable 77% 76% 79% 75% 72%
Female executives, in % of total 11% 13% 14% 15% 18%
Lost Workday Injuries, per 100 FTEs 0.45 0.38 0.31 0.27 0.23
Fatalities – 2 7 3 1
Initial and continual conformance audits, number of audits 273 212 159 200 203
Suppliers audits, compliance rate, in % 72% 75% 77% 86%
1) In manufacturing excluding new acquisitions