Philips 2014 Annual Report Download - page 41
Download and view the complete annual report
Please find page 41 of the 2014 Philips annual report below. You can navigate through the pages in the report by either clicking on the pages listed below, or by using the keyword search tool below to find specific information within the annual report.-
 1
1 -
2
-
3
-
4
-
5
-
6
-
7
-
8
-
9
-
10
-
11
-
12
-
13
-
14
-
15
-
16
-
17
-
18
-
19
-
20
-
21
-
22
-
23
-
24
-
25
-
26
-
27
-
28
-
29
-
30
-
 31
31 -
 32
32 -
 33
33 -
 34
34 -
 35
35 -
 36
36 -
 37
37 -
 38
38 -
 39
39 -
 40
40 -
 41
41 -
 42
42 -
 43
43 -
 44
44 -
 45
45 -
 46
46 -
 47
47 -
 48
48 -
 49
49 -
 50
50 -
 51
51 -
52
-
53
-
54
-
55
-
56
-
57
-
58
-
59
-
60
-
61
-
62
-
63
-
64
-
65
-
66
-
67
-
68
-
69
-
70
-
71
-
72
-
73
-
74
-
75
-
76
-
77
-
78
-
79
-
80
-
81
-
82
-
83
-
84
-
85
-
86
-
87
-
88
-
89
-
90
-
91
-
92
-
93
-
94
-
95
-
96
-
97
-
98
-
99
-
100
-
101
-
102
-
103
-
104
-
105
-
106
-
107
-
108
-
109
-
110
-
111
-
112
-
113
-
114
-
115
-
116
-
117
-
118
-
119
-
120
-
121
-
122
-
123
-
124
-
125
-
126
-
127
-
128
-
129
-
130
-
131
-
132
-
133
-
134
-
135
-
136
-
137
-
138
-
139
-
140
-
141
-
142
-
143
-
144
-
145
-
146
-
147
-
148
-
149
-
150
-
151
-
152
-
153
-
154
-
155
-
156
-
157
-
158
-
159
-
160
-
161
-
162
-
163
-
164
-
165
-
166
-
167
-
168
-
169
-
170
-
171
-
172
-
173
-
174
-
175
-
176
-
177
-
178
-
179
-
180
-
181
-
182
-
183
-
184
-
185
-
186
-
187
-
188
-
189
-
190
-
191
-
192
-
193
-
194
-
195
-
196
-
197
-
198
-
199
-
200
-
201
-
202
-
203
-
204
-
205
-
206
-
207
-
208
-
209
-
210
-
211
-
212
-
213
-
214
-
215
-
216
-
217
-
218
-
219
-
220
-
221
-
222
-
223
-
224
-
225
-
226
-
227
-
228
-
229
-
230
-
231
-
232
-
233
-
234
-
235
-
236
-
237
-
238
-
239
-
240
-
241
-
242
-
243
-
244
 |
 |
Group performance 5.3.2
Annual Report 2014 41
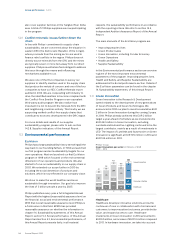
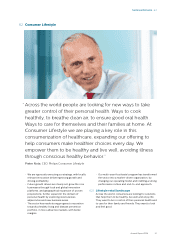
Consumer Lifestyle
Consumer Lifestyle focuses on Green Products which
meet or exceed our minimum requirements in the areas
of energy consumption, packaging, and substances of
concern. The sales of Green Products in 2014 surpassed
55% of total sales. All our Green Products with
rechargeable batteries (like toothbrushes, shavers, and
grooming products) exceed the stringent California
energy eciency norm by at least 10%. We are making
steady progress in developing PVC/BFR-free products.
More than 60% of sales consist of PVC/BFR-free
products, with the exception of the power cords, for
which there are not yet economical viable alternatives
available.
In 2014, more vacuum cleaners, coee machines and
irons were launched with parts made of recycled
plastics. In total we have applied some 625 tons of
recycled plastics in our products. An example is the new
SENSEO® Up, the plastic parts of which consist of 13%
recycled material.
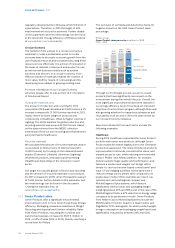
Lighting
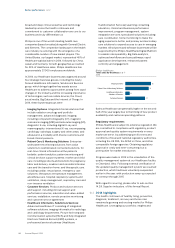
Green Product sales within Lighting increased from 70%
in 2013 to 72% in 2014. Connected lighting systems
contributed to Green Product sales with solutions like
CityTouch, a system for outdoor lighting management.
CityTouch oers simple web applications to remotely
control street lights and analyze related data. This gives
cities the exibility to dim lights to low levels wherever
possible to save energy, or to boost light levels at the
touch of a button when more light is needed (for
example, in the case of an accident). The system helps
cities save energy and operate more eciently, while
increasing citizens’ feeling of safety.
CityTouch technology is spreading around the world,
with installations in Buenos Aires, Rotterdam, and
Markham, Ontario, Canada. In the Spanish town of
Salobre, CityTouch software combines with LED
luminaires to reduce the municipality’s energy
consumption by more than 70% and cut CO2 emissions
by 29 tons per year. In a number of London boroughs,
over 70,000 light points will be managed by CityTouch.
5.3.3 Green Operations
The Green Operations program focuses on the main
contributors to climate change, recycling of waste,
reduction of water consumption and reduction of
emissions of restricted and hazardous substances. Full
details can be found in chapter 14, Sustainability
statements, of this Annual Report.
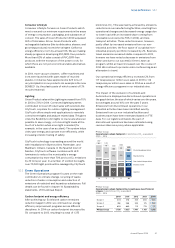
Carbon footprint and energy eciency
After achieving our EcoVision4 carbon emissions
reduction target in 2012, we continued our energy
eciency improvement programs across dierent
disciplines. In 2014 our carbon footprint decreased by
5% compared to 2013, resulting in a total of 1,375
kilotonnes CO2. This was mainly achieved by emissions
reductions in our manufacturing facilities, resulting from
operational changes and decreased energy usage due
to lower load with an increased share coming from
renewable sources (some 55% in 2014), and less
transport activities. These reductions were, however,
partly oset by increased emissions from our non-
industrial activities, the oor space of our global non-
industrial property portfolio increased by 2%. Business
travel emissions remained stable compared to 2013,
however we have noted a decrease in emissions from
lease cars due to our successful Green Lease car
program, whilst air travel increased over the course of
2014. We continue to promote video conferencing as an
alternative to travel.
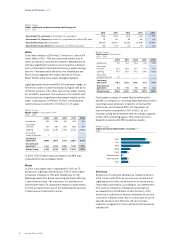
Our operational energy eciency increased 2% from
1.17 terajoules per million euro sales in 2013 to 1.14
terajoules per million euro sales in 2014 as a result of
energy eciency programs in our industrial sites.
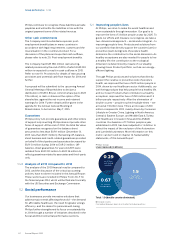
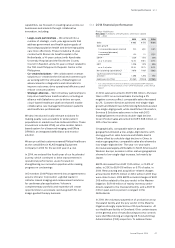
The impact of the exclusion of Lumileds and
Automotive is displayed as discontinued operations in
the graph below; the size of which varies over the years,
but averages around 10% over the past 5 years.
Emissions from discontinued operations in our
industrial activities have been identied exactly.
Emissions from our non-industrial facilities and
business travel have been estimated based on FTE
data. For our logistics emissions the part of
discontinued operations has been estimated using
revenue share as a proxy where applicable.
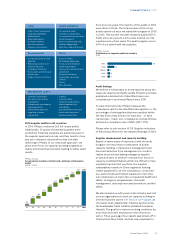
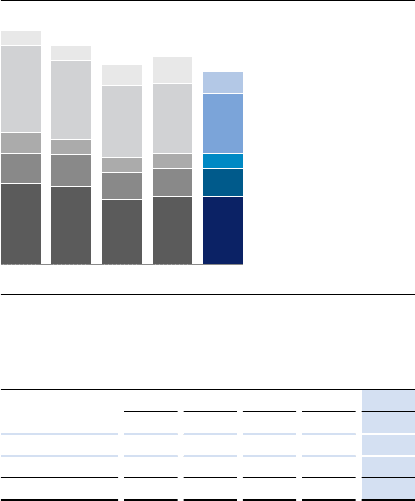
Philips Group
Operational carbon footprint in kilotonnes CO2-equivalent
2010 - 2014
649
246
163
698
121
1,877
‘10
632
256
119
628
118
1,753
‘11
525
216
118
582
160
1,601
‘12
550
226
117
558
213
1,664
‘13
545 Logistics
227 Business travel
124 Non-industrial operations
479 Manufacturing
168 Discontinued operations
1,543
‘14
Philips Group
Operational carbon footprint by Greenhouse Gas Protocol
scopes in kilotonnes CO2-equivalent
2010 - 2014
2010 2011 2012 2013 2014
Scope 1 403 378 355 360 320
Scope 2 458 368 345 315 283
Scope 3 895 889 741 776 772
Philips Group 1,756 1,635 1,441 1,451 1,375