Philips 2014 Annual Report Download - page 26
Download and view the complete annual report
Please find page 26 of the 2014 Philips annual report below. You can navigate through the pages in the report by either clicking on the pages listed below, or by using the keyword search tool below to find specific information within the annual report.-
 1
1 -
2
-
3
-
4
-
5
-
6
-
7
-
8
-
9
-
10
-
11
-
12
-
13
-
14
-
15
-
 16
16 -
 17
17 -
 18
18 -
 19
19 -
 20
20 -
 21
21 -
 22
22 -
 23
23 -
 24
24 -
 25
25 -
 26
26 -
 27
27 -
 28
28 -
 29
29 -
 30
30 -
 31
31 -
 32
32 -
 33
33 -
 34
34 -
 35
35 -
 36
36 -
37
-
38
-
39
-
40
-
41
-
42
-
43
-
44
-
45
-
46
-
47
-
48
-
49
-
50
-
51
-
52
-
53
-
54
-
55
-
56
-
57
-
58
-
59
-
60
-
61
-
62
-
63
-
64
-
65
-
66
-
67
-
68
-
69
-
70
-
71
-
72
-
73
-
74
-
75
-
76
-
77
-
78
-
79
-
80
-
81
-
82
-
83
-
84
-
85
-
86
-
87
-
88
-
89
-
90
-
91
-
92
-
93
-
94
-
95
-
96
-
97
-
98
-
99
-
100
-
101
-
102
-
103
-
104
-
105
-
106
-
107
-
108
-
109
-
110
-
111
-
112
-
113
-
114
-
115
-
116
-
117
-
118
-
119
-
120
-
121
-
122
-
123
-
124
-
125
-
126
-
127
-
128
-
129
-
130
-
131
-
132
-
133
-
134
-
135
-
136
-
137
-
138
-
139
-
140
-
141
-
142
-
143
-
144
-
145
-
146
-
147
-
148
-
149
-
150
-
151
-
152
-
153
-
154
-
155
-
156
-
157
-
158
-
159
-
160
-
161
-
162
-
163
-
164
-
165
-
166
-
167
-
168
-
169
-
170
-
171
-
172
-
173
-
174
-
175
-
176
-
177
-
178
-
179
-
180
-
181
-
182
-
183
-
184
-
185
-
186
-
187
-
188
-
189
-
190
-
191
-
192
-
193
-
194
-
195
-
196
-
197
-
198
-
199
-
200
-
201
-
202
-
203
-
204
-
205
-
206
-
207
-
208
-
209
-
210
-
211
-
212
-
213
-
214
-
215
-
216
-
217
-
218
-
219
-
220
-
221
-
222
-
223
-
224
-
225
-
226
-
227
-
228
-
229
-
230
-
231
-
232
-
233
-
234
-
235
-
236
-
237
-
238
-
239
-
240
-
241
-
242
-
243
-
244
 |
 |

Group performance 5.1.7
26 Annual Report 2014
5.1.7 Financial income and expenses
A breakdown of Financial income and expenses is
presented in the table below.
Philips Group
Financial income and expenses in millions of EUR
2012 - 2014
2012 2013 2014
Interest expense (net) (326) (269) (251)
Sale of securities 1 – 60
Impairments (8) (10) (17)
Other 4 (51) (93)
Financial income and expenses (329) (330) (301)
Net interest expense in 2014 was EUR 18 million lower
than in 2013, mainly as a result of lower average
outstanding debt and interest related to pensions in
2014.
The gain from the sale of stakes in 2014 amounted to
EUR 60 million, mainly from Neusoft, Chimei Innolux,
Gilde III and Sapiens.
Other nancial expense amounted to EUR 93 million in
2014, primarily consisting of interest expense related to
the jury verdict in the Masimo litigation, and accretion
expense associated with other discounted provisions
and uncertain tax positions.
For further information, refer to note 7, Financial income
and expenses.
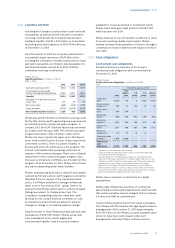
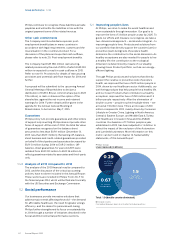
5.1.8 Income taxes
Income taxes amounted to EUR 26 million, compared
to EUR 466 million in 2013. The eective income tax rate
was 14.1%. The decrease in 2014 was mainly due to
lower income before tax and application of favorable
tax regulations relating to R&D investments. The
comparable eective income tax rate for 2013 was
30.6%.
For 2015, the eective tax rate is expected to be in the
range of 28% and 30%. However, the actual rate will
depend on the geographical mix of actual prots.
For further information, refer to note 8, Income taxes.
5.1.9 Results of investments in associates
Philips Group
Results of investments in associates in millions of EUR
2012 - 2014
2012 2013 2014
Company’s participation in income (5) 5 30
Investment impairment and other
charges (206) (30) –
Dilution gain – – 32
Results of Investments in
associates (211) (25) 62
The results related to investments in associates
improved from a loss of EUR 25 million in 2013 to a gain
of EUR 62 million in 2014. 2014 included a EUR 32
million dilution gain related to Philips’ stake in Corindus
Vascular Robotics, while 2013 included a provision for
the net impact of expected payments related to the
agreed transfer of the remaining 30% stake in the TP
Vision joint venture.
The Company’s participation in income increased from
EUR 5 million in 2013 to a gain of EUR 30 million in 2014.
The gain in 2013 was mainly attributable to the results
of Philips Medical Capital.
For further information, refer to note 5, Interests in
entities.
5.1.10 Non-controlling interests
Net income attributable to non-controlling interests
amounted to a loss of EUR 4 million in 2014, compared
to a gain of EUR 3 million in 2013.
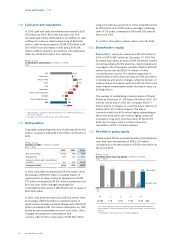
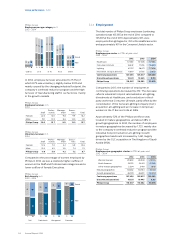
5.1.11 Discontinued operations
Discontinued operations consist primarily of the
combined businesses of Lumileds and Automotive, the
Audio, Video, Multimedia and Accessories (AVM&A)
business, and the Television business. The results
related to these businesses are reported under
Discontinued operations in the Consolidated
statements of income and Consolidated statements of
cash ows.
On June 30, 2014, Philips announced the start of the
process to combine the Lumileds and Automotive
Lighting businesses into a stand-alone company and
explore strategic options to attract capital from third-
party investors for this combined business. Philips is
actively discussing the sale of the business with
potential buyers and expects a transaction to be
completed in the rst half of 2015.
The AVM&A business, also known as WooX Innovations,
was divested to Gibson Brands Inc. in June 2014.
The Television business was divested as part of a
strategic partnership agreement with TPV Technology
Ltd (TPV) that was signed on April 1, 2012. Philips
retained a 30% interest in TP Vision Holdings BV (TP
Vision venture) and on May 29, 2014 transferred the
remaining 30% stake in TP Vision to TPV. After
completion, TPV fully owns TP Vision, which will enable
further integration with TPV’s TV business.
Income from discontinued operations increased by
EUR 52 million to EUR 190 million in 2014. The year-on-
year increase was mainly due to a net gain related to
the divestment of our Television business. Income from
discontinued operations mainly consisted of net
income of EUR 141 million related to the combined
businesses of Lumileds and Automotive, EUR 18 million