Philips 2014 Annual Report Download - page 166
Download and view the complete annual report
Please find page 166 of the 2014 Philips annual report below. You can navigate through the pages in the report by either clicking on the pages listed below, or by using the keyword search tool below to find specific information within the annual report.-
 1
1 -
2
-
3
-
4
-
5
-
6
-
7
-
8
-
9
-
10
-
11
-
12
-
13
-
14
-
15
-
16
-
17
-
18
-
19
-
20
-
21
-
22
-
23
-
24
-
25
-
26
-
27
-
28
-
29
-
30
-
31
-
32
-
33
-
34
-
35
-
36
-
37
-
38
-
39
-
40
-
41
-
42
-
43
-
44
-
45
-
46
-
47
-
48
-
49
-
50
-
51
-
52
-
53
-
54
-
55
-
56
-
57
-
58
-
59
-
60
-
61
-
62
-
63
-
64
-
65
-
66
-
67
-
68
-
69
-
70
-
71
-
72
-
73
-
74
-
75
-
76
-
77
-
78
-
79
-
80
-
81
-
82
-
83
-
84
-
85
-
86
-
87
-
88
-
89
-
90
-
91
-
92
-
93
-
94
-
95
-
96
-
97
-
98
-
99
-
100
-
101
-
102
-
103
-
104
-
105
-
106
-
107
-
108
-
109
-
110
-
111
-
112
-
113
-
114
-
115
-
116
-
117
-
118
-
119
-
120
-
121
-
122
-
123
-
124
-
125
-
126
-
127
-
128
-
129
-
130
-
131
-
132
-
133
-
134
-
135
-
136
-
137
-
138
-
139
-
140
-
141
-
142
-
143
-
144
-
145
-
146
-
147
-
148
-
149
-
150
-
151
-
152
-
153
-
154
-
155
-
 156
156 -
 157
157 -
 158
158 -
 159
159 -
 160
160 -
 161
161 -
 162
162 -
 163
163 -
 164
164 -
 165
165 -
 166
166 -
 167
167 -
 168
168 -
 169
169 -
 170
170 -
 171
171 -
 172
172 -
 173
173 -
 174
174 -
 175
175 -
 176
176 -
177
-
178
-
179
-
180
-
181
-
182
-
183
-
184
-
185
-
186
-
187
-
188
-
189
-
190
-
191
-
192
-
193
-
194
-
195
-
196
-
197
-
198
-
199
-
200
-
201
-
202
-
203
-
204
-
205
-
206
-
207
-
208
-
209
-
210
-
211
-
212
-
213
-
214
-
215
-
216
-
217
-
218
-
219
-
220
-
221
-
222
-
223
-
224
-
225
-
226
-
227
-
228
-
229
-
230
-
231
-
232
-
233
-
234
-
235
-
236
-
237
-
238
-
239
-
240
-
241
-
242
-
243
-
244
 |
 |
Group nancial statements 12.9
166 Annual Report 2014
Philips Group
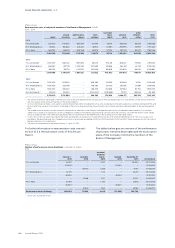
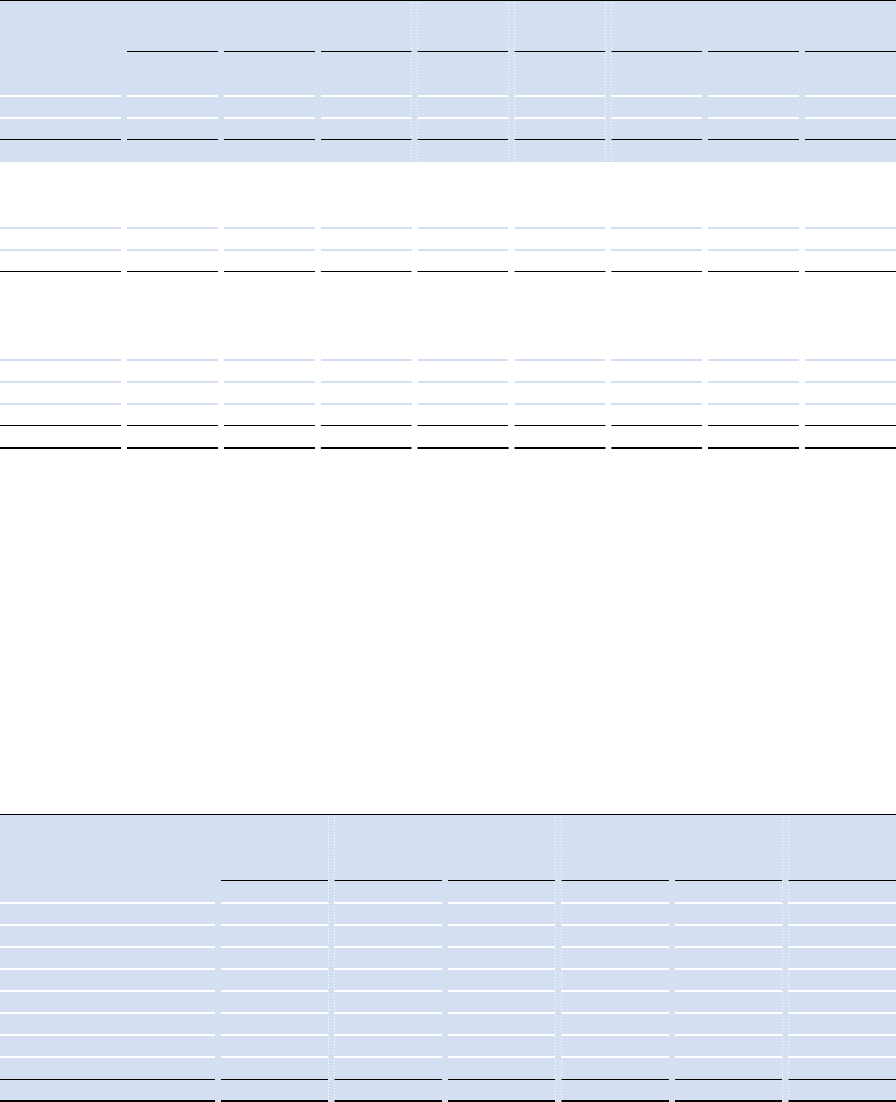
Remuneration costs of individual members of the Board of Management in EUR
2012 - 2014
salary
annual
incentive1)
performance
shares2)
stock
options2)
restricted
share
rights2)
pension
costs
other
compen-
sation3)
total
costs
2014
F.A. van Houten 1,137,500 349,600 860,564 101,344 76,951 485,655 86,554 3,098,168
R.H. Wirahadiraksa 712,500 156,600 446,337 68,914 52,965 298,995 35,909 1,772,220
P.A.J. Nota 643,750 258,180 406,358 68,914 57,200 267,037 63,507 1,764,946
2,493,750 764,380 1,713,259 239,172 187,116 1,051,687 185,970 6,635,334
20134)
F.A. van Houten 1,100,000 1,081,520 1,594,675 461,215 190,441 468,407 75,906 4,972,164
R.H. Wirahadiraksa 656,250 497,745 1,040,393 307,699 128,856 263,451 35,732 2,930,126
P.A.J. Nota 618,750 561,713 1,025,153 352,608 146,626 253,605 68,206 3,026,661
2,375,000 2,140,978 3,660,221 1,121,522 465,923 985,463 179,844 10,928,951
20124)
F.A. van Houten 1,100,000 1,279,520 − 209,589 315,760 422,845 47,154 3,374,868
R.H. Wirahadiraksa 600,000 523,440 − 149,067 217,020 243,438 34,961 1,767,926
P.A.J. Nota 600,000 556,200 − 188,029 253,836 247,883 60,754 1,906,702
S.H. Rusckowski 5) 233,333 178,500 − (200,400) (209,638) 90,211 159,833 251,839
2,533,333 2,537,660 − 346,285 576,978 1,004,377 302,702 7,301,335
1) The annual incentives are related to the performance in the year reported which are paid out in the subsequent year. For more details on the annual incentives,
see sub-section 10.2.6, Annual Incentive, of this Annual Report
2) Costs of performance shares, stock options and restricted share rights (including the once-only Accelerate! Grant) are based on accounting standards (IFRS) and
do not reect the value of stock options at the end of the lock up period and the value of performance shares and restricted share rights at the vesting/release
date
3) The stated amounts mainly concern (share of) allowances to members of the Board of Management that can be considered as remuneration. In a situation
where such a share of an allowance can be considered as (indirect) remuneration (for example, private use of the company car), then the share is both valued
and accounted for here. The method employed by the scal authorities in the Netherlands is the starting point for the value stated.
4) A crisis levy of 16% has been imposed by the Dutch government amounting to in total EUR 413,405 for 2012 and EUR 681,596 for 2013. This crisis tax levy was
payable by the employer and was charged over income of employees exceeding a EUR 150,000 threshold in 2012 and 2013. These expenses do not form part of
the remuneration costs mentioned.
5) The amount stated relate to the period January 1 - April 30, 2012.
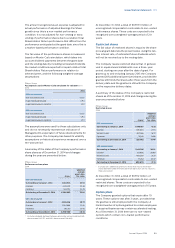
For further information on remuneration costs, see sub-
section 10.2.4, Remuneration costs, of this Annual
Report.
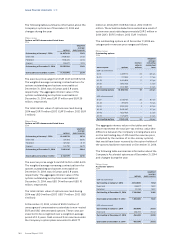
The tables below give an overview of the performance
share plans, restricted share rights and the stock option
plans of the Company, held by the members of the
Board of Management:
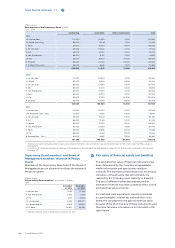
Philips Group
Number of performance shares (holdings) in number of shares
2014
January 1,
2014
awarded
2014
awarded
dividend
shares
2014
realized
2014
December 31,
2014 vesting date
F.A. van Houten 64,671 − 2,232 − 66,903 05.03.2016
55,0001) − − 55,000 − 01.28.2014
− 59,075 2,038 − 61,113 04.28.2017
R.H. Wirahadiraksa 33,071 − 1,141 − 34,212 05.03.2016
38,5001) − − 38,500 − 01.28.2014
− 31,036 1,071 − 32,107 04.28.2017
P.A.J. Nota 30,621 − 1,057 − 31,678 05.03.2016
38,5001) − − 38,500 − 01.28.2014
− 27,825 960 − 28,785 04.28.2017
Performance shares (holdings)260,363 117,936 8,499 132,000 254,798
1) Once-only Accelerate! Grant