Philips 2014 Annual Report Download - page 209
Download and view the complete annual report
Please find page 209 of the 2014 Philips annual report below. You can navigate through the pages in the report by either clicking on the pages listed below, or by using the keyword search tool below to find specific information within the annual report.-
 1
1 -
2
-
3
-
4
-
5
-
6
-
7
-
8
-
9
-
10
-
11
-
12
-
13
-
14
-
15
-
16
-
17
-
18
-
19
-
20
-
21
-
22
-
23
-
24
-
25
-
26
-
27
-
28
-
29
-
30
-
31
-
32
-
33
-
34
-
35
-
36
-
37
-
38
-
39
-
40
-
41
-
42
-
43
-
44
-
45
-
46
-
47
-
48
-
49
-
50
-
51
-
52
-
53
-
54
-
55
-
56
-
57
-
58
-
59
-
60
-
61
-
62
-
63
-
64
-
65
-
66
-
67
-
68
-
69
-
70
-
71
-
72
-
73
-
74
-
75
-
76
-
77
-
78
-
79
-
80
-
81
-
82
-
83
-
84
-
85
-
86
-
87
-
88
-
89
-
90
-
91
-
92
-
93
-
94
-
95
-
96
-
97
-
98
-
99
-
100
-
101
-
102
-
103
-
104
-
105
-
106
-
107
-
108
-
109
-
110
-
111
-
112
-
113
-
114
-
115
-
116
-
117
-
118
-
119
-
120
-
121
-
122
-
123
-
124
-
125
-
126
-
127
-
128
-
129
-
130
-
131
-
132
-
133
-
134
-
135
-
136
-
137
-
138
-
139
-
140
-
141
-
142
-
143
-
144
-
145
-
146
-
147
-
148
-
149
-
150
-
151
-
152
-
153
-
154
-
155
-
156
-
157
-
158
-
159
-
160
-
161
-
162
-
163
-
164
-
165
-
166
-
167
-
168
-
169
-
170
-
171
-
172
-
173
-
174
-
175
-
176
-
177
-
178
-
179
-
180
-
181
-
182
-
183
-
184
-
185
-
186
-
187
-
188
-
189
-
190
-
191
-
192
-
193
-
194
-
195
-
196
-
197
-
198
-
 199
199 -
 200
200 -
 201
201 -
 202
202 -
 203
203 -
 204
204 -
 205
205 -
 206
206 -
 207
207 -
 208
208 -
 209
209 -
 210
210 -
 211
211 -
 212
212 -
 213
213 -
 214
214 -
 215
215 -
 216
216 -
 217
217 -
 218
218 -
 219
219 -
220
-
221
-
222
-
223
-
224
-
225
-
226
-
227
-
228
-
229
-
230
-
231
-
232
-
233
-
234
-
235
-
236
-
237
-
238
-
239
-
240
-
241
-
242
-
243
-
244
 |
 |

Sustainability statements 14.3.1
Annual Report 2014 209
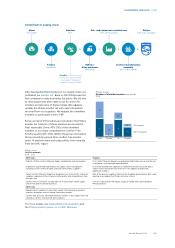
this year we have had to estimate emissions based
on revenue trend. During 2015 we will nd a suitable
solution to ensure data availability.
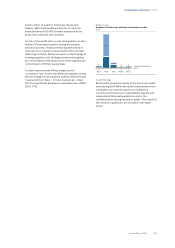
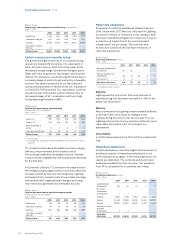
Philips Group
Operational carbon footprint for logistics
in kilotonnes CO2-equivalent
2010 - 2014
2010 2011 2012 2013 2014
Air transport 332 316 295 308 316
Road transport 150 164 98 101 96
Sea transport 167 152 132 141 133
Philips Group 649 632 525 550 545
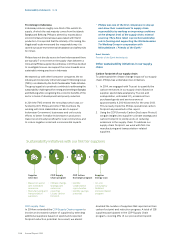
14.3.2 Biodiversity
Philips recognizes the importance of healthy
ecosystems and rich biodiversity for our company, our
employees, and society as a whole. We aim to minimize
any negative impacts and actively promote ecosystem
restoration activities including biodiversity restoration
projects with social components, sustainable
development, poverty relief.
The Philips Biodiversity policy was issued in 2014 and
progress was made on biodiversity management, both
on sites (e.g. impact measurement), on natural capital
valuation and on the management level. Most
initiatives were led by the Philips Leaders for Nature
(LFN) team, site management, local sustainability
organizations worldwide and Group Sustainability in
Eindhoven, the Netherlands. We continued our global
partnership with the International Union for the
Conservation of Nature (IUCN) Netherlands Committee
and our participation in the IUCN LFN program which
brings companies, NGOs and governments together to
work on the topic of business and biodiversity. Next, we
made intensive use of the internal company-wide
social network platform to create and share activities
and achievements including training programs.
In 2014 a biodiversity impact assessment was
performed for all our industrial sites, using the geo-
locations of these sites and the Integrated Biodiversity
Assessment Tool (IBAT). For every industrial site the
nearest Key Biodiversity Area or IUCN protected area
was determined as well as the distance to such area.
After further validation with our industrial site sta, it
appeared that only our Glemsford (UK) site is located
within a radius of 1 kilometer from such an area, the
Glemsford Pits, but has no impact on its biodiversity.
The results of our assessment for all industrial sites can
be found at www.philips.com/sustainability.
Philips continued in 2014 to work with Trucost and
performed an Environmental Prot and Loss (EP&L)
analysis to help identify natural capital dependency
“hot spots” and place a nancial value on Philips
environmental impacts. The environmental impact of
Philips itself is limited as the company is not very energy
intensive and is not emitting large quantities of high
impact substances. The impact of our supply chain
however is signicantly higher than our own impact. For
this reason, we used the identied hot-spots in our
supply chain as input for our CDP Supply Chain
program. More information on that program can be
found at sub-section 14.2.8, Supplier indicators, of this
Annual Report. In this Annual Report, Philips has also
followed the IIRC Integrated Reporting <IR> framework
which includes natural capital as a source of value
creation. Together with the WBCSD we are further
developing the EP&L concept and methodology,
including the environmental benets.
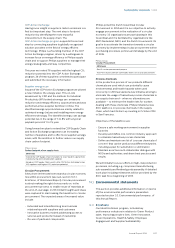
14.3.3 Green Operations
Our Green Operations program, related to improving
the environmental performance of our manufacturing
facilities, focuses on most contributors to climate
change, but also addresses water, recycling of waste
and chemical substances.
In the course of 2013 we implemented an improved
process to report chemicals used in processes in more
detail. New chemicals on which we will focus our
reduction eorts and new reduction targets will be
incorporated in the next Green Operations program.
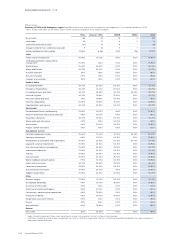
Philips Group
Green Operations in % unless otherwise stated
2014
2007
baseline year
2014
actual1)
2015
target1)
Total CO2 from
manufacturing
873 kilotonnes CO2
-equivalent (46) (25)
Water 4.0 million m3 (21) (10)
Materials provided for
recycling via external
contractor per total waste 79 80 80
Restricted substances:
Benzene emission 52 kg (100) (50)
Mercury emission 185 kg (96) (100)
CFCs, HCFCs 156 kg (100) (100)
Hazardous substances
Lead emission 1,838 kg (100) (100)
PFCs 1,534 kg (100) (35)
Toluene emission 2,210 kg (93) (90)
Xylene emission 4,502 kg 410 (90)
Styrene 80,526 kg (94) (90)
Antimony, Arsenic and
their compounds 18 kg (100) (100)
1) Against the base year 2007
Energy use in manufacturing
Total energy usage in manufacturing amounted to
11,257 terajoules in 2014, of which Lighting consumes
about 74%. Compared to 2013, energy consumption at
Philips went down by 6%. This was driven by a decrease
of activities in high energy intensive operations in
Lighting, organizational changes, and energy eciency
improvements, partly oset by new acquisitions
reporting for the rst time. The energy use of our
discontinued operations amounted to 2,160 terajoules
in 2014 (2013: 2,197 terajoules).